US dollar vs Swiss franc support breakdown continues strong bearish trend
Price action on USD/CHF (daily chart) as of October 18, 2012, has tentatively broken down below a key support area around the 0.9250 price region, […]
Price action on USD/CHF (daily chart) as of October 18, 2012, has tentatively broken down below a key support area around the 0.9250 price region, […]
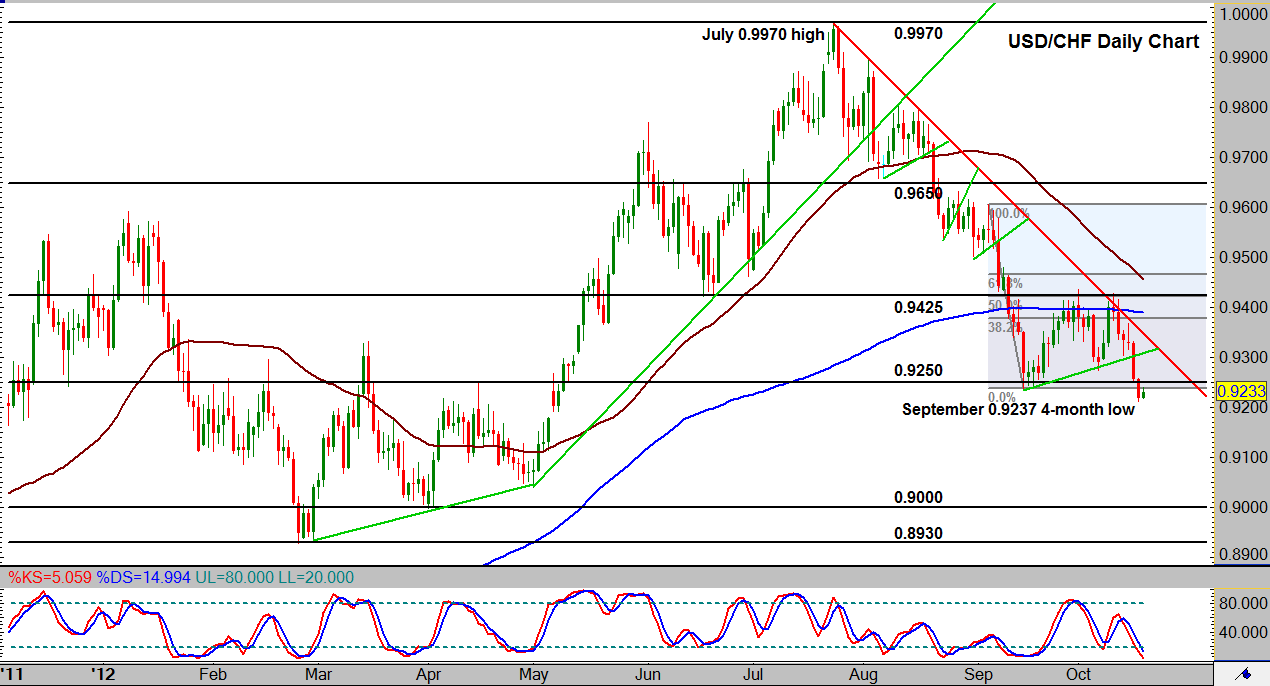
Price action on USD/CHF (daily chart) as of October 18, 2012, has tentatively broken down below a key support area around the 0.9250 price region, potentially confirming a continuation of the entrenched bearish trend that has been in place since the July 0.9970 high.
The resistance trend line that traces the upper border of this bearish trend for the last three months displays at least four touches since inception, with the last touch effectively ending a bullish correction just last week.
Another current bearish indication is that the price is well below both the key 50- and 200-day moving averages, both of which are also currently sloped to the downside. With the tentative confirmation of the bearish trend’s downside continuation, the price could begin moving towards the key 0.9000 area support. To the upside, any significant breakout above the three-month downtrend resistance line could signify a potential end to the current bearish trend.