US dollar vs Japanese Yen reaches multi year highs
USD/JPY (daily chart), as of January 3, 2013, has sustained its bullish stance into the new year after having spent the last three months in […]
USD/JPY (daily chart), as of January 3, 2013, has sustained its bullish stance into the new year after having spent the last three months in […]
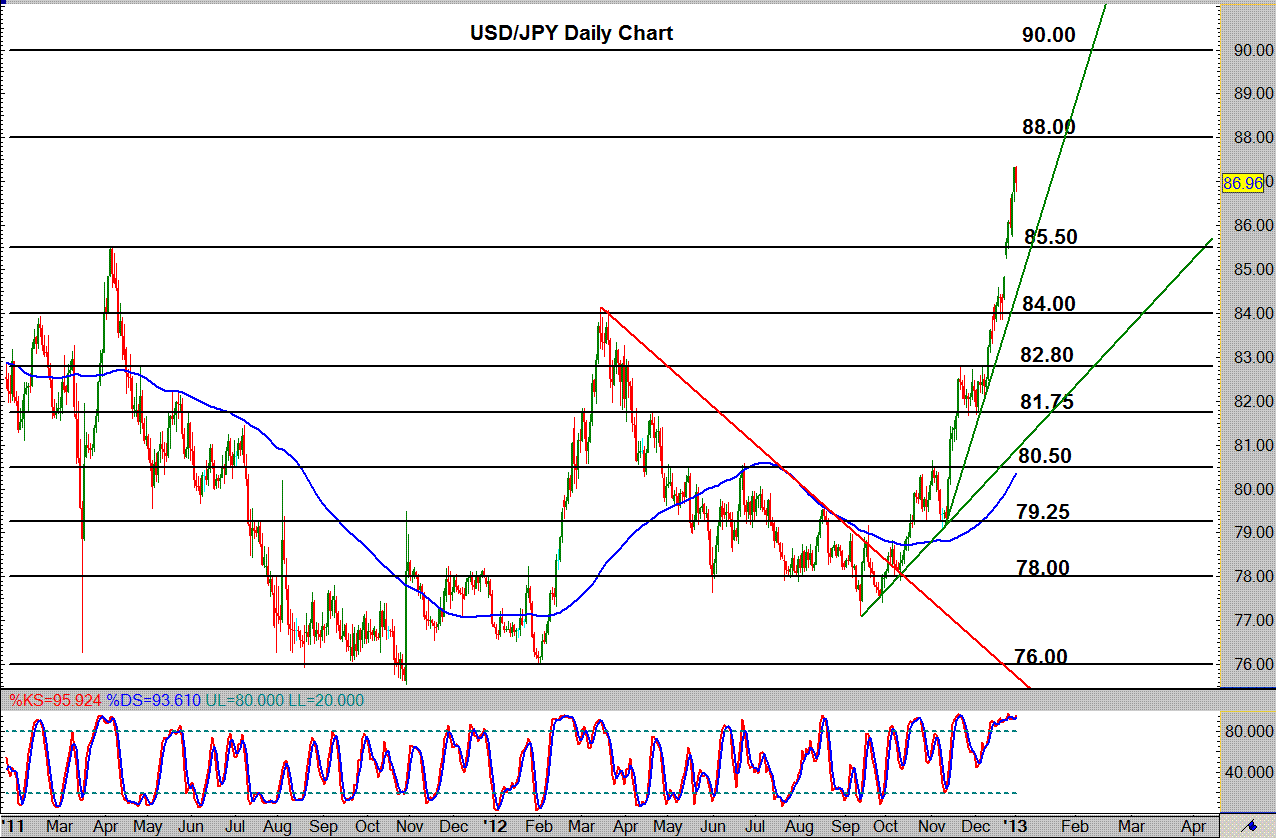
USD/JPY (daily chart), as of January 3, 2013, has sustained its bullish stance into the new year after having spent the last three months in a steep, stair-step ascent that broke out above several key price levels. After its push above 82.80 in mid-December, USD/JPY went on to break out above 84.00 and then 85.50 in late December before surging even further to hit a high well above 87.00 on the first trading day of 2013, establishing a 29-month high in the process.
Although the price has pulled back today, and further bearish corrections could potentially be forthcoming, the trend momentum has been steeply bullish. With key potential resistance to the upside around the 88.00 level, which was last valid throughout 2010, a breakout above that level could move higher towards the psychologically important 90.00 level. A bearish correction on the current bullish over-extension could find strong potential support once again around the 85.50 level.
