US Dollar vs Canadian Dollar Retreats from Strong Resistance
USD/CAD (daily chart) as of November 20, 2012 has shown a marked decline after having touched and respected key resistance around the 1.0050 price region […]
USD/CAD (daily chart) as of November 20, 2012 has shown a marked decline after having touched and respected key resistance around the 1.0050 price region […]
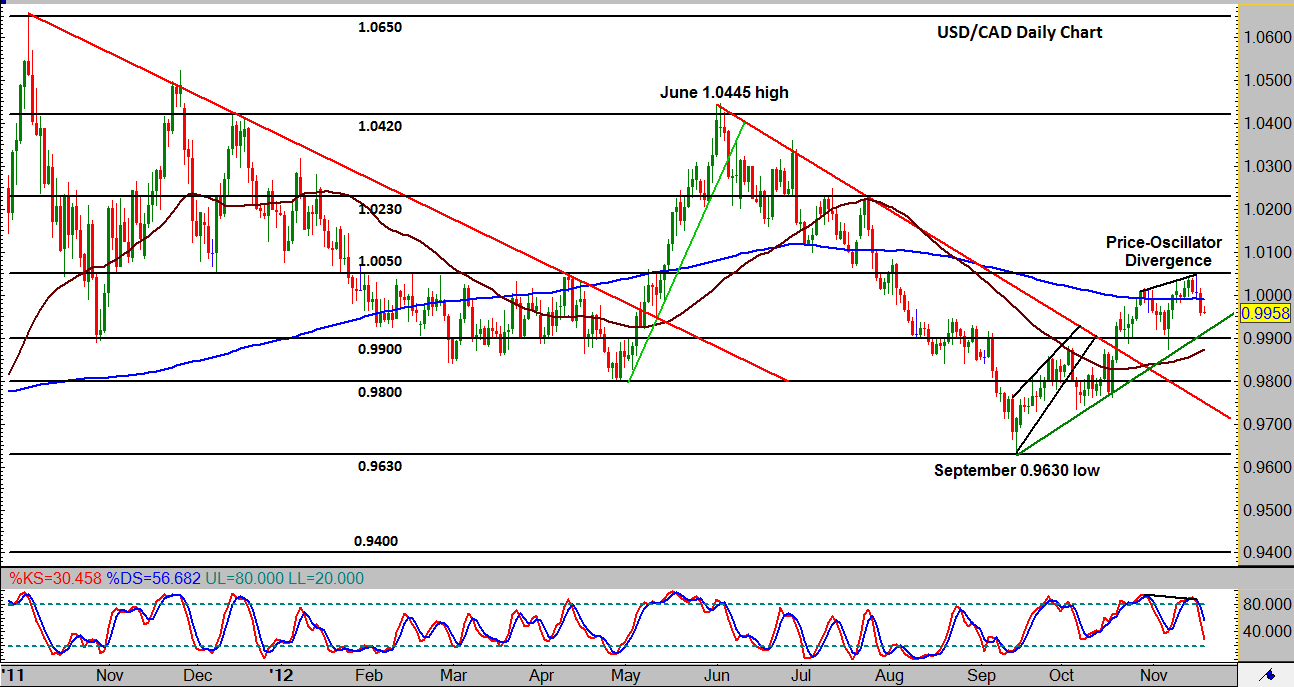
USD/CAD (daily chart) as of November 20, 2012 has shown a marked decline after having touched and respected key resistance around the 1.0050 price region just above parity. This decline of the past two days follows a clear bearish divergence indication between price and oscillator, hinting at a potential loss of the uptrend momentum that has been in place since the September 0.9630 low. This retreat from key 1.0050 resistance also occurs after price broke out above both a strong bearish trend line and the important 0.9900 resistance level in the latter half of October. If price is able to stay below 1.0050 resistance and re-break below 0.9900, thereby breaking down the short-term bullish trend that has been in place since the September 0.9630 low, price could decline further towards a potential downside re-test of the 0.9800 and then 0.9630 levels. To the upside, in the event of a subsequent breakout above the important 1.0050 resistance, price could move towards a further potential resistance objective around the 1.0230 price region.