


May 6, 2020 5:21 PM
US Dollar Index: A Technical Look
Since the coronavirus pandemic began to spread outside of China, traders haven’t been able to figure out quite what to do with the US Dollar. As the daily chart of the US Dollar Index (DXY) shows, from February 21st (when coronavirus fears began to take hold) until March 9th, the DXY sold off from 99.87 down to 94.65. Traders were fearful that the US could get hit hard by the virus and that the Fed would have to lower interest rates from a high level, relative to other countries. Their fears turned out to be true (and then some). Notice that since mid-January, the correlation coefficient between the US Dollar and the S&P 500 was positive. Many people assume that the US Dollar and stock indices move in opposite directions, however that is not always the case.
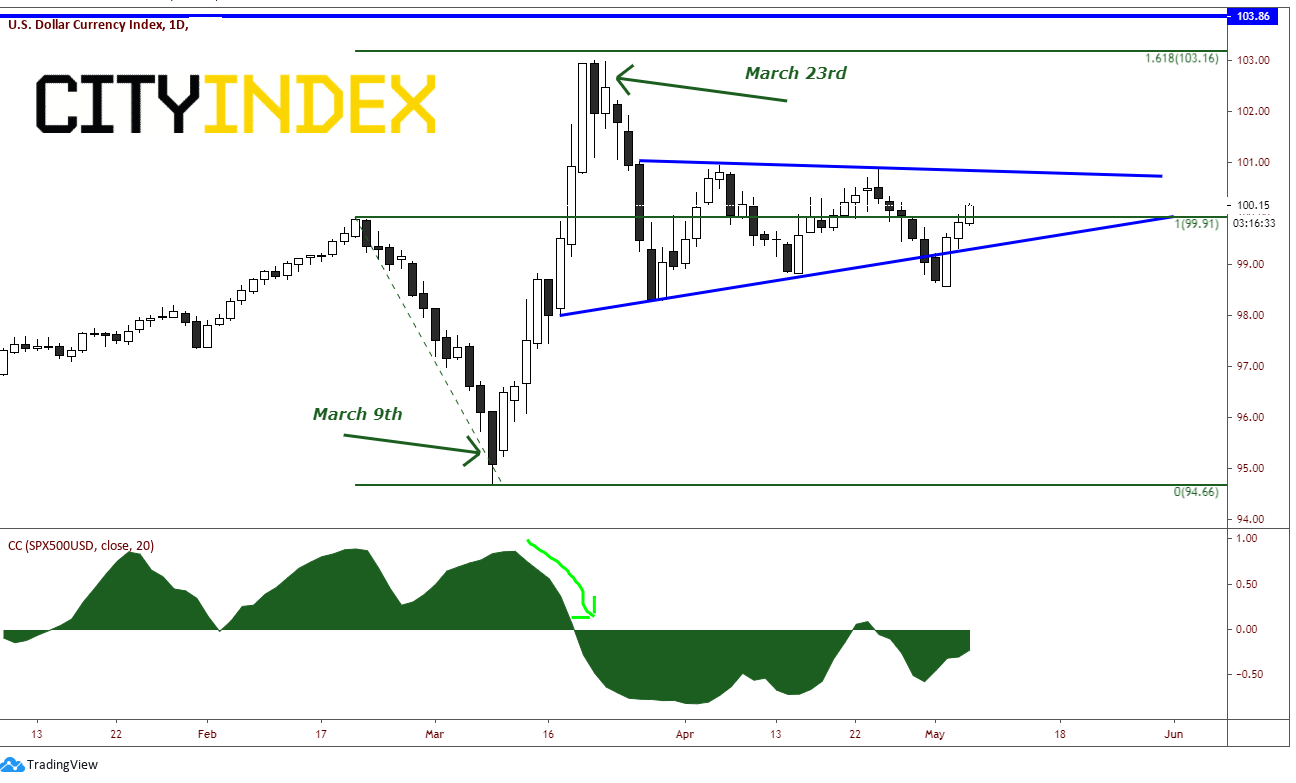
Source: Tradingview, City Index
On March 10th, as stocks were nearly halfway to their lows of the selloff, the DXY reversed and moved toward the 161.8% Fibonacci extension from the February 21st highs to the March 9th lows, near 103.00. Investors became really worried about the virus, and the US Dollar became the “safe haven” . This was a rapid move which ended on March 23rd, the same day the S&P 500 put in its lows at 2174. Notice how the DXY and the S&P 500 returned to their expected negative correlation. Over the course of that week, the DXY sold off to the 50% retracement level from the lows of March 9th to the highs of March 23rd . The S&P 500 rallied over 10% that week.
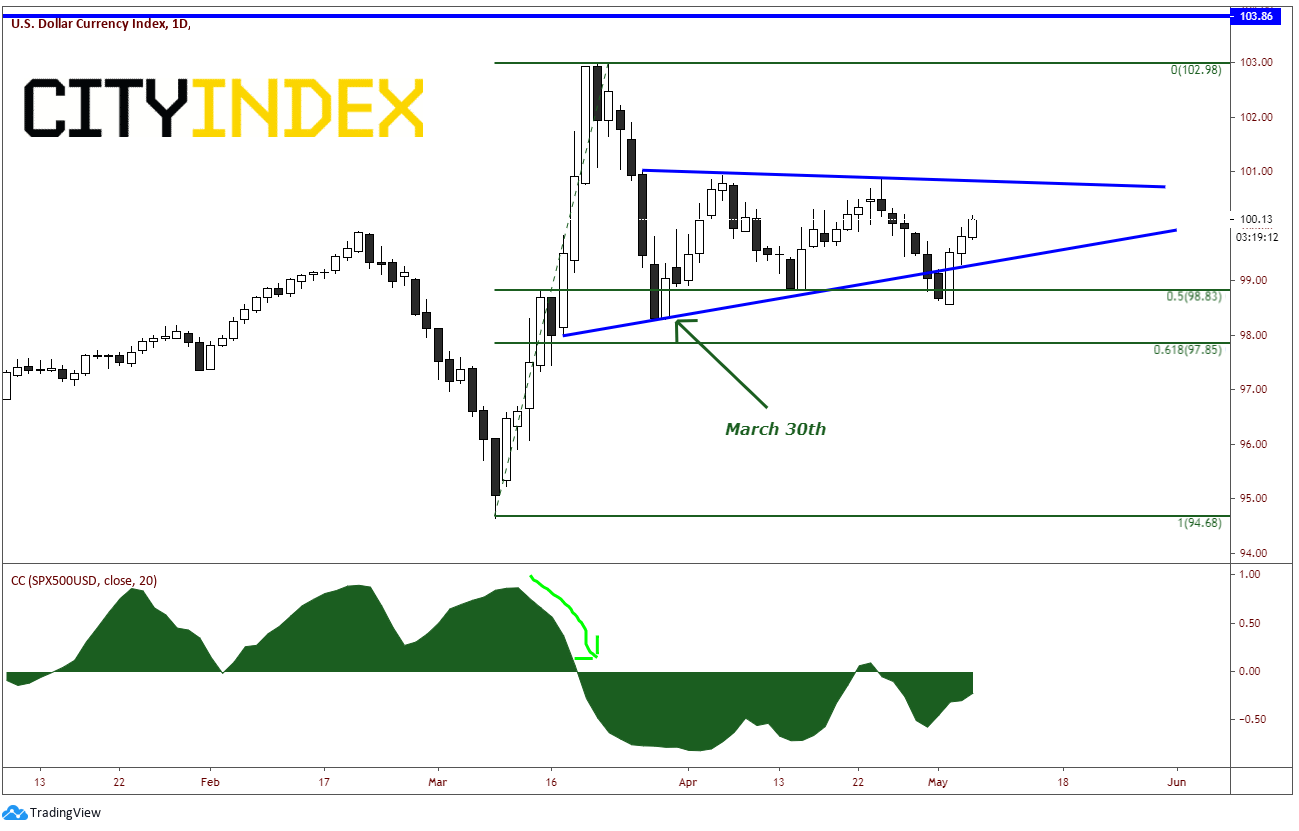
Source: Tradingview, City Index
Notice how the DXY failed to hold below the 50% retracement level on March 30th. The DXY traded in a sideways symmetrical triangle pattern throughout April, however failed once again to hold below the previously mentioned 50% retracement level on May 1st.
The weekly close is turning out to be very important for the DXY. The index sold off everyday last week as month end US Dollar selling dominated late April. However, when the market opened on Monday, it was off to the races as the DXY went bid. There are still 2 days left in the week, however the DXY has a high this week of 100.20. Last week’s high was 100.32. If the DXY can close above last weeks highs, the weekly candle will be a bullish engulfing candle, which is a very bullish 1 candlestick reversal formation! The next level of resistance will be near April highs and the downward sloping trendline from the triangle near 100.80/100.93 and horizontal resistance just above 101.00. Above there the DXY can retest the March highs near 103. Support is far away at Monday’s lows of 98.57.
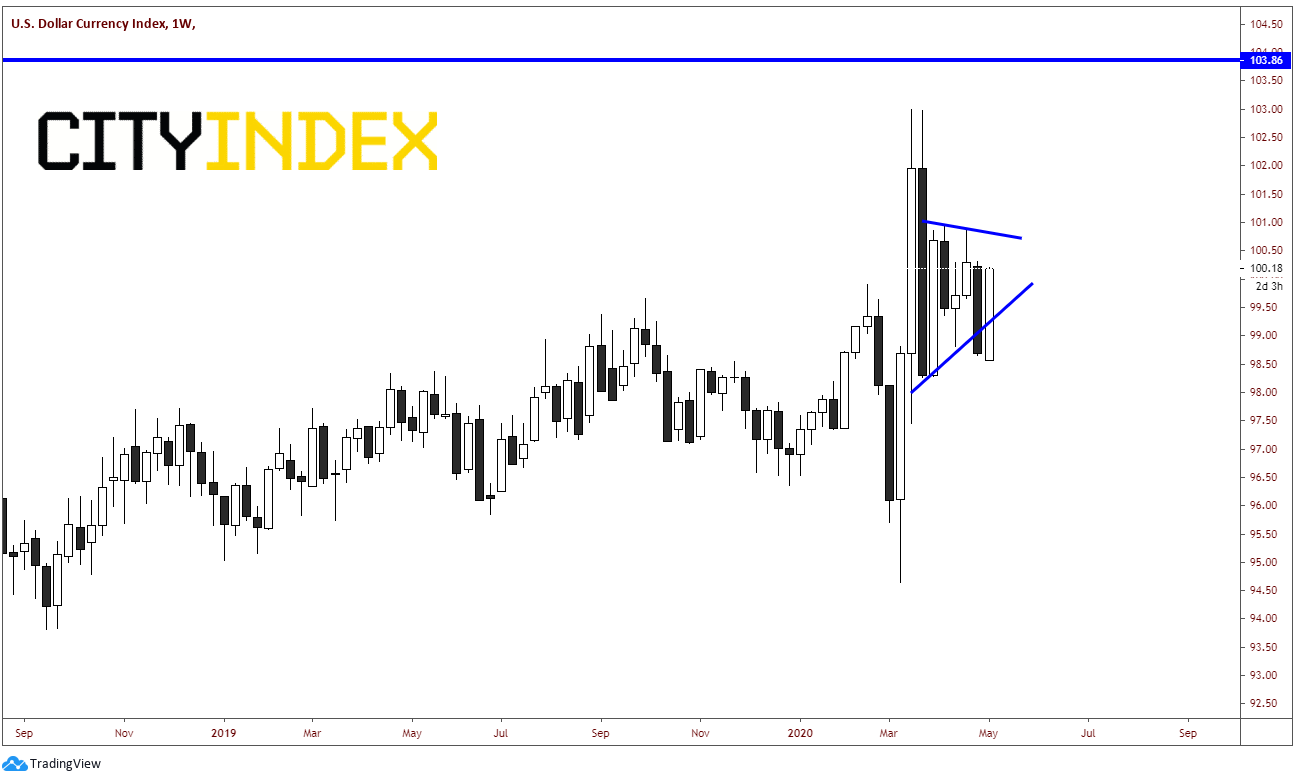
Source: Tradingview, City Index
Although there are still 2 days left in the week, if the DXY can close above 100.32, then it has room to run on the upside!
Latest market news
Today 11:14 AM
Today 08:28 AM
Yesterday 03:30 PM
Latest Forex articles

Yesterday 11:00 AM
April 23, 2024 11:09 PM
April 23, 2024 04:00 PM