


December 14, 2021 9:37 PM
The US Dollar is at or near new highs for the year vs many currencies. With the selloff today in stocks on Tuesday, the DXY is moving higher as well.
What is the US Dollar Index (DXY)?
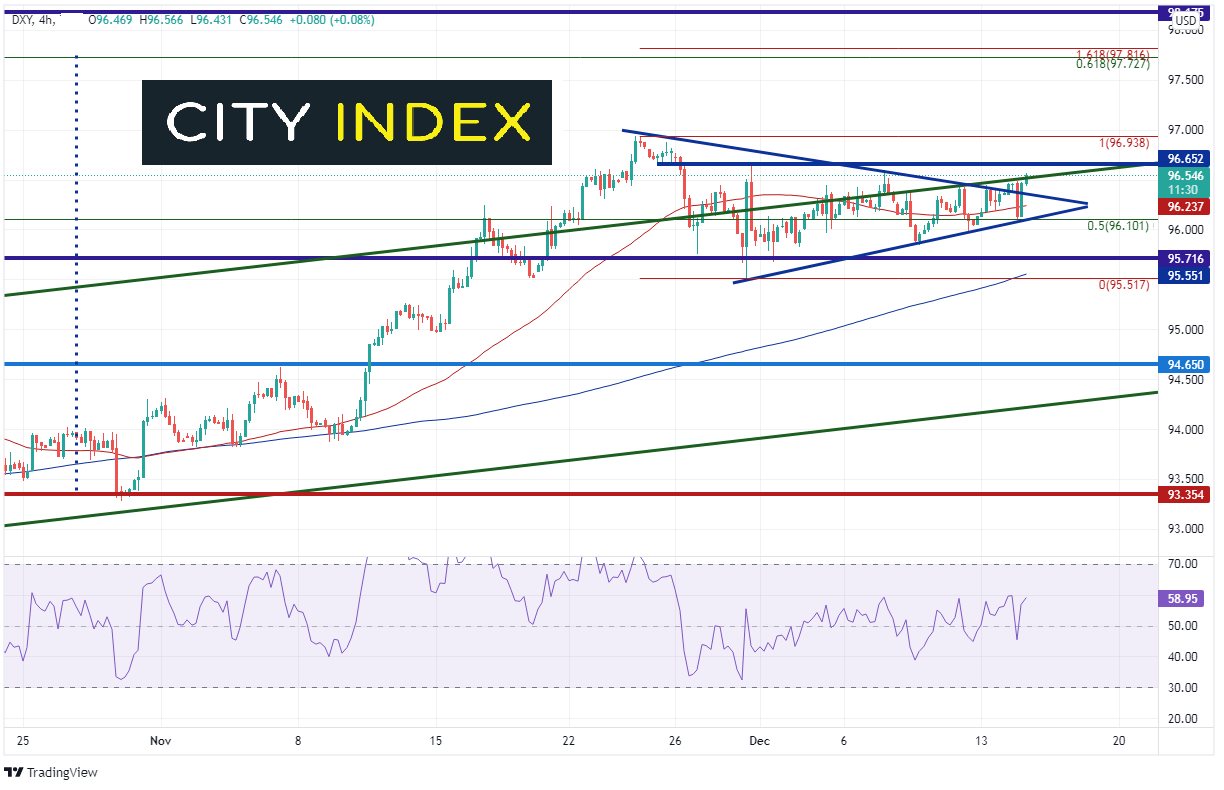
On a 240-minute timeframe, the US Dollar Index (DXY) broke out of a continuation triangle on Monday and pressed against resistance at the top trendline of the long term upward sloping triangle. Tuesday, the DXY closed above that trendline and could be on its way to new highs for the year at 96.94. The only level in the way is horizontal resistance at 96.65. Above the highs, the DXY could make it to the double bottom target on the longer-term timeframe near 97.75 (see vertical blue line on left of DXY chart below). Note that there is a confluence of resistance at 97.73/97.82 consisting of the 61.8% Fibonacci retracement level from the March 2020 highs to the January 6th lows, as well as, the 161.8% Fibonacci extension from the November 24th highs to the November 30th lows. Support is at the top downward sloping trendline of the triangle near 96.38, the 50 Day Moving Average at 96.24 and the upward trendline of the triangle near 96.10.
Source: Tradingview, Stone X
What will inflation look like in 2022? See our inflation outlook!
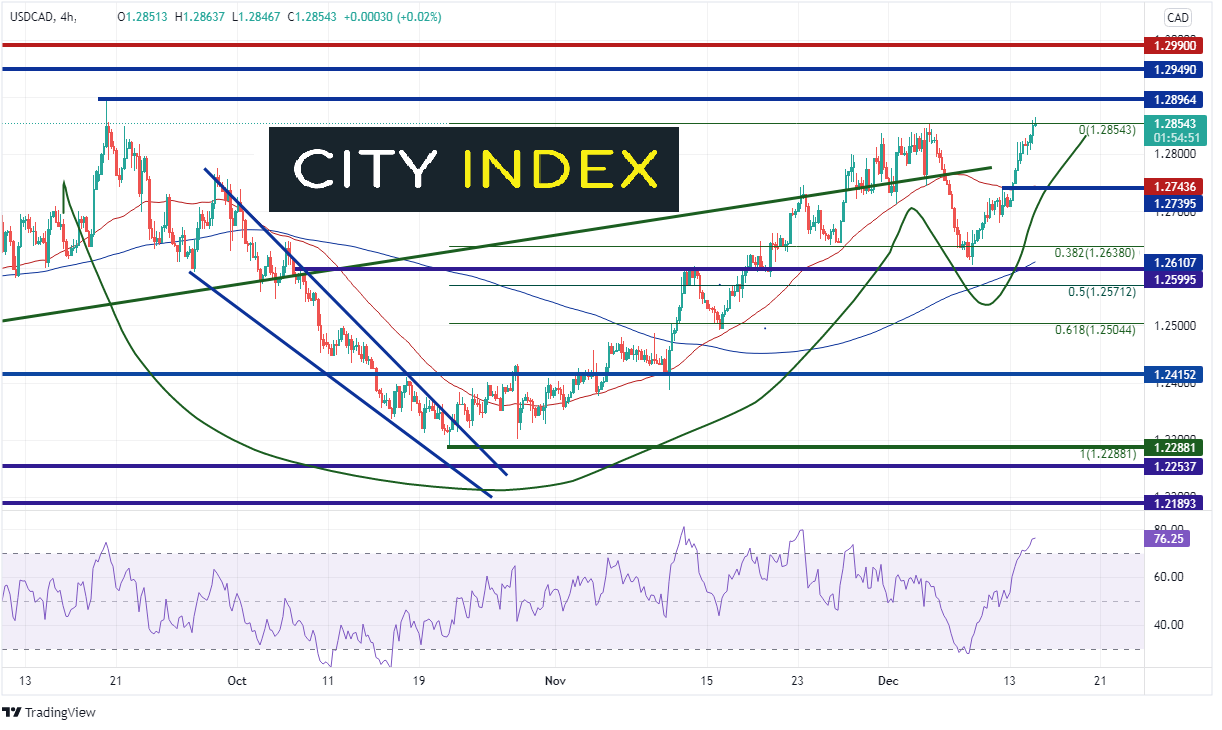
With the Bank of Canada meeting out of the way, there is only the US Dollar side of the equation to concerned about this week, as the Fed meetings on Wednesday. With the bid in the DXY, the index is helping to lift USD/CAD. The pair closed at its highest level in 2021 on Tuesday, near 1.2855 and broke out of a Cup-and-Handle formation. Three levels of horizontal sit above at previous highs of 1.2896, 2021 highs at 1.2949 and long-term horizontal resistance at 1.2990. Horizontal support and the 50-Day Moving Average are near 1.2740 and then the December 8th lows and horizontal support near 1.2600/1.2610.
Source: Tradingview, Stone X
Trade USD/CAD now: Login or Open a new account!
• Open an account in the UK
• Open an account in Australia
• Open an account in Singapore
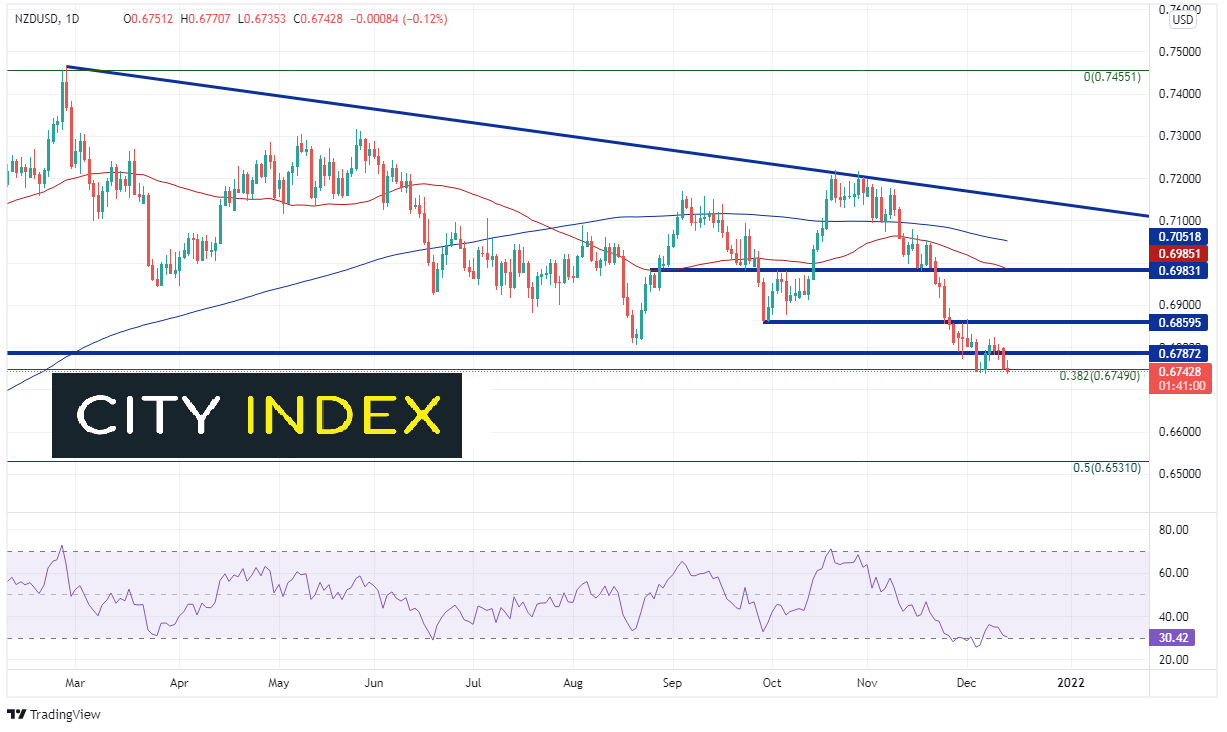
Interestingly enough, the RBNZ doesn’t meet this week either. (RBNZ, BOC, and RBA are the only major central banks not to meet this week). The US Dollar made new yearly highs vs the Kiwi on Wednesday as NZD/USD made new yearly lows at 0.6735. The pair has plenty of room to fall from here on the daily timeframe, as the next level of support isn’t until the 50% retracement level from the lows of March 2020 to the highs of February 25th at 0.6531. (As of the time of this writing, NZD/USD is sitting a few pips below the 38.2% Fibonacci retracement level, which is 0.6749.) If the US Dollar selloffs, NZD/USD could move higher. Horizontal resistance is at 0.6860, then a confluence of additional horizontal resistance and the 50 Day Moving Average at 0.6985. The 200-Day Moving Average is at 0.7052.
Source: Tradingview, Stone X
Trade NZD/USD now: Login or Open a new account!
• Open an account in the UK
• Open an account in Australia
• Open an account in Singapore
As inflation surges in the US, the US Dollar has made new 2021 highs, and new 2021 closing highs, vs some currencies. In others, the US Dollar is near 2021 highs. This strength could change depending on what the Fed does on Wednesday. However, use the mentioned levels as guides as to where price may pause if there is a strong move in either direction.
Learn more about forex trading opportunities.
Latest market news
Yesterday 01:23 PM
Yesterday 06:01 AM
April 18, 2024 11:27 PM
April 18, 2024 04:46 PM
Latest Trade Ideas articles

April 18, 2024 11:27 PM
April 18, 2024 04:46 PM