


October 13, 2021 5:44 PM
US headline CPI for September was 5.4% YoY vs an expectation of 5.3% YoY and August’s print of 5.3% YoY. Although is was only a slight increase, it provides additional evidence that inflation remains far above the Fed’s target of 2%, and that perhaps inflation may not be as transitory as the Fed had originally thought. This is the 5th month in a row the reading has been 5% or greater and equals June and July prints as the highest in 13 years. Not surprisingly, food, energy and shelter were the largest cost inputs. However, Core CPI (YoY) for September remained at 4%, as expected. The core print excludes food and energy. Thus, even without the large contributors to the headline number, the core is still much higher than the Fed would like! The September CPI gives the Fed another box to check in terms of meeting goals towards tapering.
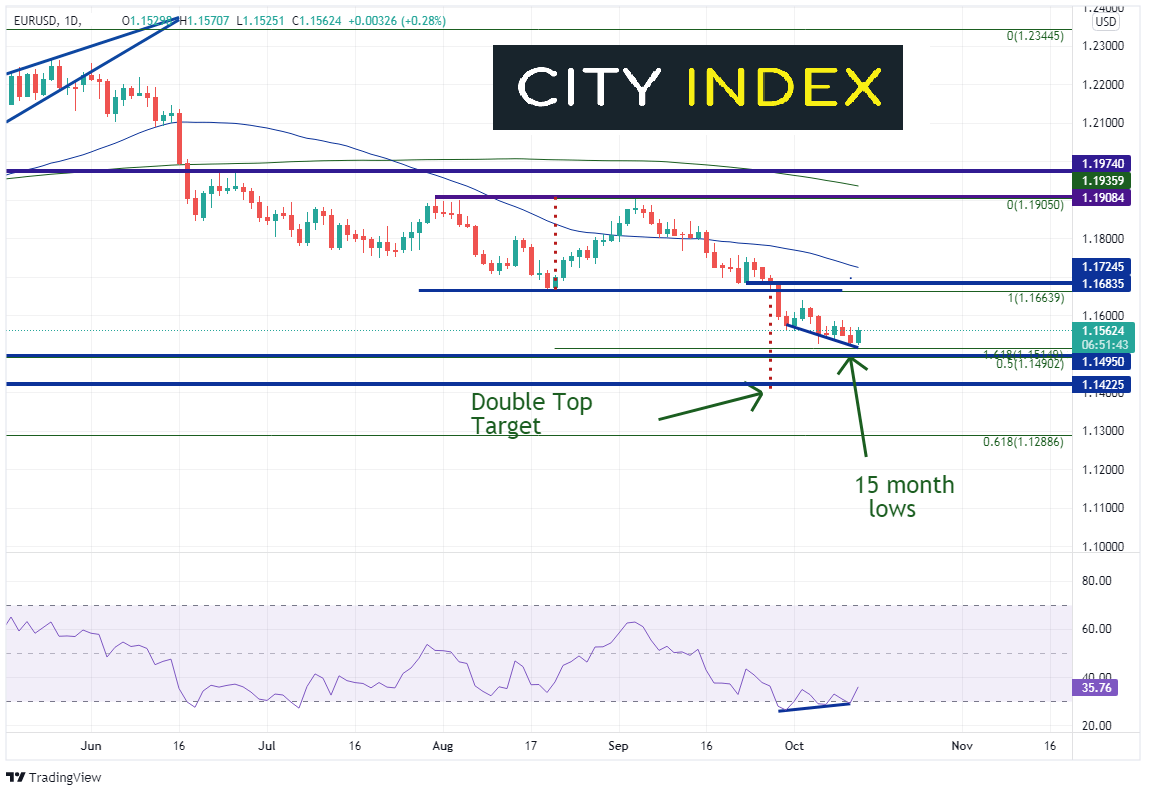
EUR/USD made new 15-month lows yesterday at 1.1525. However, with a divergence between the RSI and price, there was the possibility of a bounce.
Source: Tradingview, Stone X
Trade EUR/USD now: Login or Open a new account!
• Open an account in the UK
• Open an account in Australia
• Open an account in Singapore
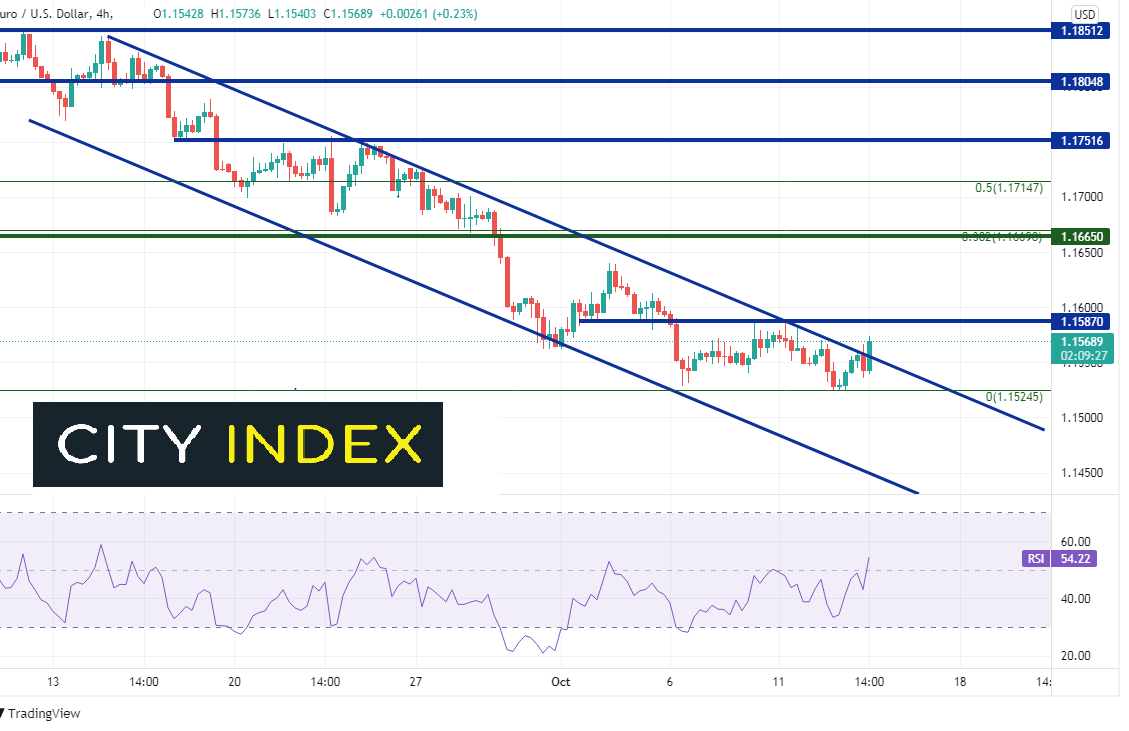
With the bounce today back above yesterday’s highs, EUR/USD has pushed above the downward sloping channel it has been in since early September. Horizontal resistance is at the October 11th highs near 1.1587. Note that EUR/USD hasn’t traded above 1.1600 since October 5th. Strong horizontal resistance sits at 1.1665, which is also near the 38.2% Fibonacci retracement from the September 3rd highs to yesterday’s lows, at 1.1669. The 50% retracement level from the same timeframe is at 1.1747, just above the 50-Day Moving Average at 1.1725. Support is at yesterday’s low of 1.1525, just above the 161.8% Fibonacci extension from the lows of August 23rd to the highs of September 3rd, near 1.1515 (see daily chart). Horizontal support is just below at 1.1495.
Source: Tradingview, Stone X
Trade XAU/USD now: Login or Open a new account!
• Open an account in the UK
• Open an account in Australia
• Open an account in Singapore
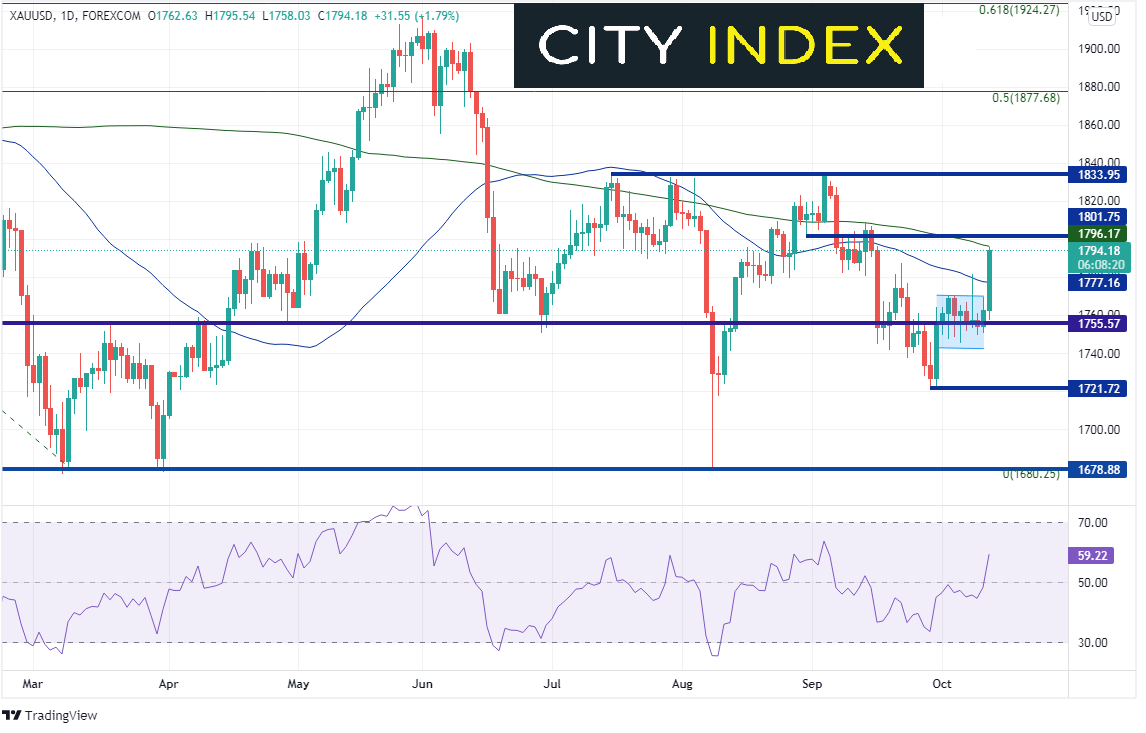
With the pullback in the US Dollar (bid in EUR/USD), Gold has finally been able to bounce. XAU/USD has been trading in a range since October 1st between 1745.97 and 1781.39. Today, Gold broke above the range and above the 50-Day Moving Average at 1777.04. If price can close above, the 200-Day Moving average provides the next level of resistance at 1796.15. Horizontal resistance above there is at 1801.75 and 1833.95. First support is back at the top of the range near 1769.41, then today’s lows at 1758.03. Horizontal support below there is at 1721.72 and then the august 9th lows at 1678.88.
Source: Tradingview, Stone X
While the CPI provided traders with more evidence that the Fed will taper on November 3rd, traders in the EUR/USD and Gold may be taking profits or shaking out weak shorts. However, as more and more US data is released, it becomes more apparent that the Fed will announce tapering at its November 3rd meeting. PPI is up next!
Learn more about forex trading opportunities.


