November 13, 2019 9:52 AM
US CPI a Non-Event, Powell Up Next
US CPI was released earlier today as the headline number MoM for October came in stronger than expected at 0.4% vs 0.3% expected and 0.0 in September. However, the more important component of the data was the release of US Core CPI YoY. This is one of the major data points which the Fed watches to get a better gauge of true inflation as it excludes food and energy prices. The US Core CPI YoY for October was slightly weaker at 2.3% vs 2.4% expected and 2.4% last. Note that this figure is still above the Fed’s target rate for inflation of 2.0%.
Speaking of the Fed, today Fed Chairman Powell is set to speak today at 11:00am EST in front of the Joint Economic Committee (JEC) to give the Fed’s updated views of the US Economy. Chairman Powell stated recently that the economy “is in a good place”. Markets will be looking to see if he echoes these comments today. If so, this will confirm the FOMC’s sentiment that interest rates are on hold for the time being. The CME FedWatch Tool is currently pricing in a 96% chance of the FOMC leaving rates unchanged at its December 11th meeting.
The US Dollar Index (DXY), in particular, will be paying attention to any signs from Powell of a change an expected change in inflation and employment. On a weekly chart, price as been trading in an upward sloping channel since May 2018. Price tried to break lower out of the channel a few weeks ago, however ran into support and was rejected at the upward sloping bottom trendline of the channel and the 50-week moving average.
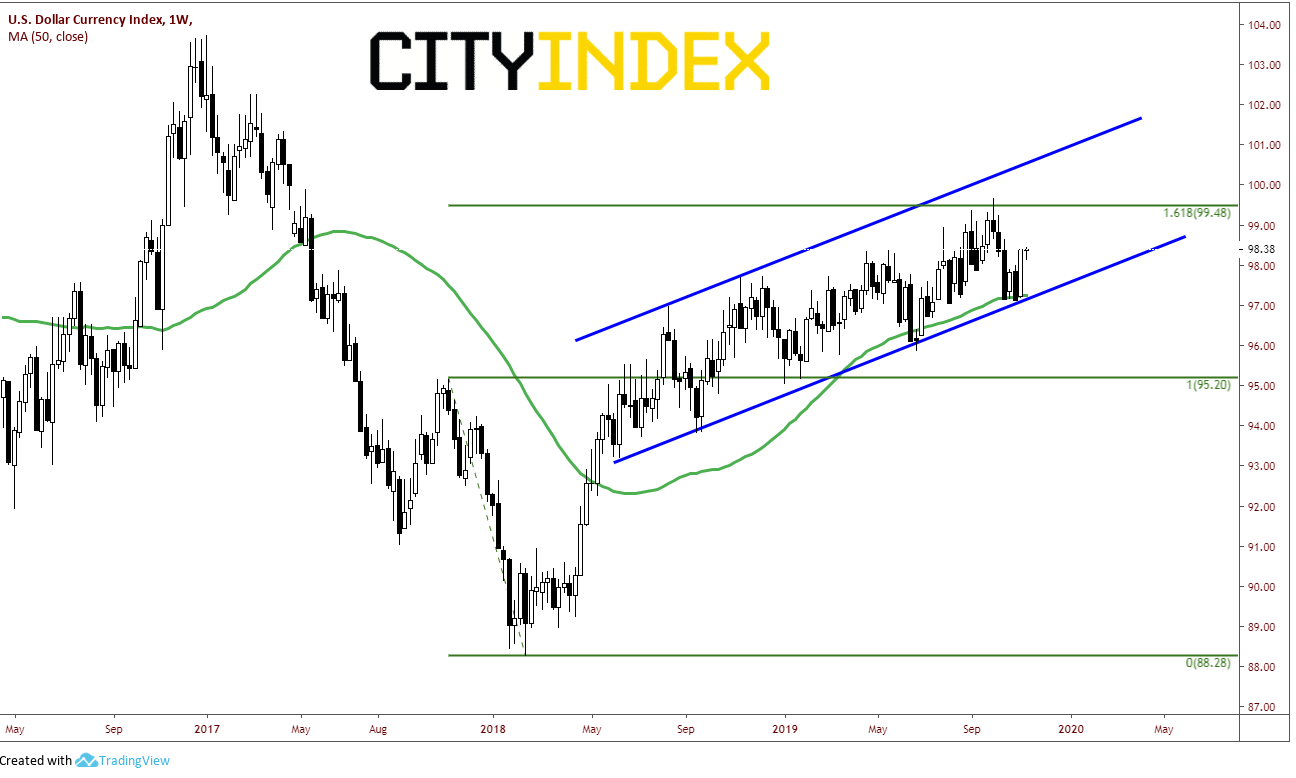
Source: Tradingview, City Index
On a daily timeframe, we can see clearly that the DXY formed a flag near the lows and tried to break lower through the channel support and the 200-day moving average, only to fail as bulls gained control and turned it higher back into the channel range.
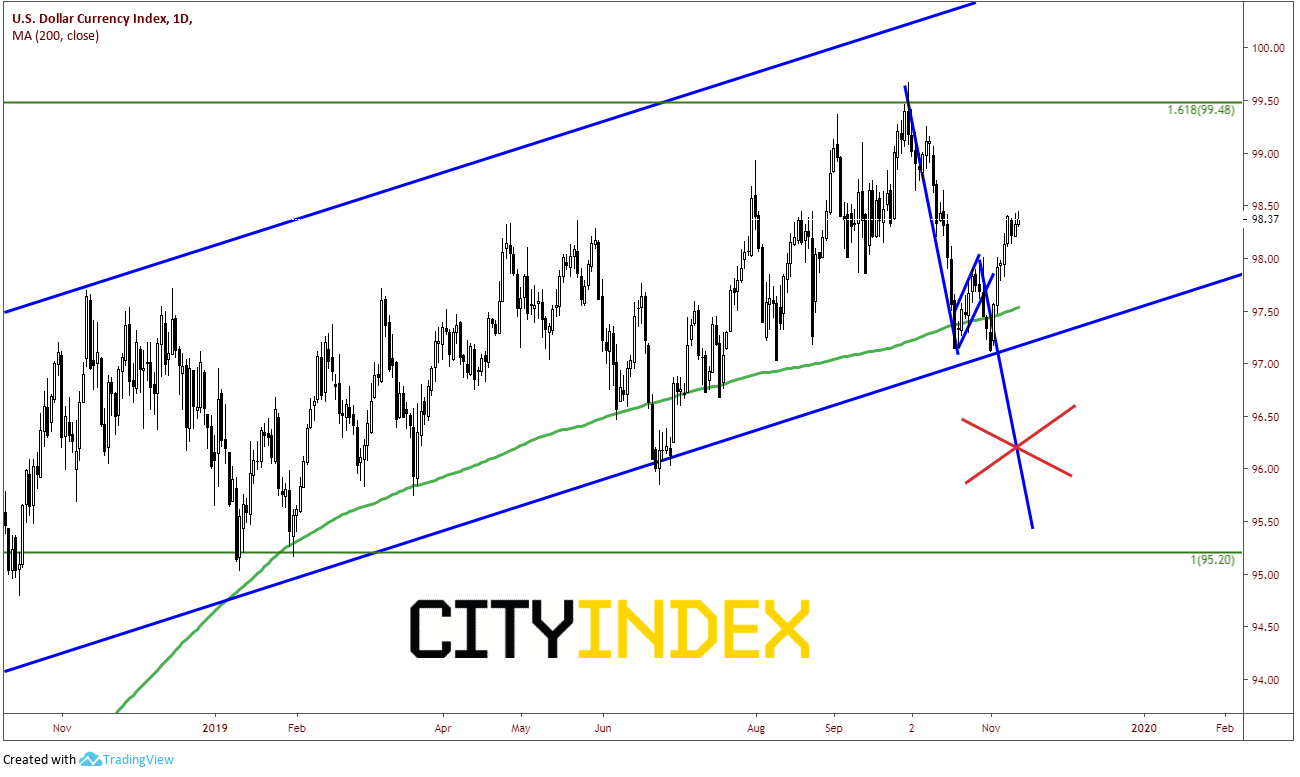
Source: Tradingview, City Index
On a 240-minute chart, price put in a double bottom at the lows near 97.15. The target for a double bottom is the height of the pattern added to the breakout point. This level of 98.60 coincides with previous support (which now acts as resistance) as well as the 61.8% Fibonacci retracement of the highs on October 1st to the lows on November 1st. Price has currently stalked near 98.38, near the 50% retracement of the previously mentioned timeframe. Horizonal support below near the breakout point at 97.87.
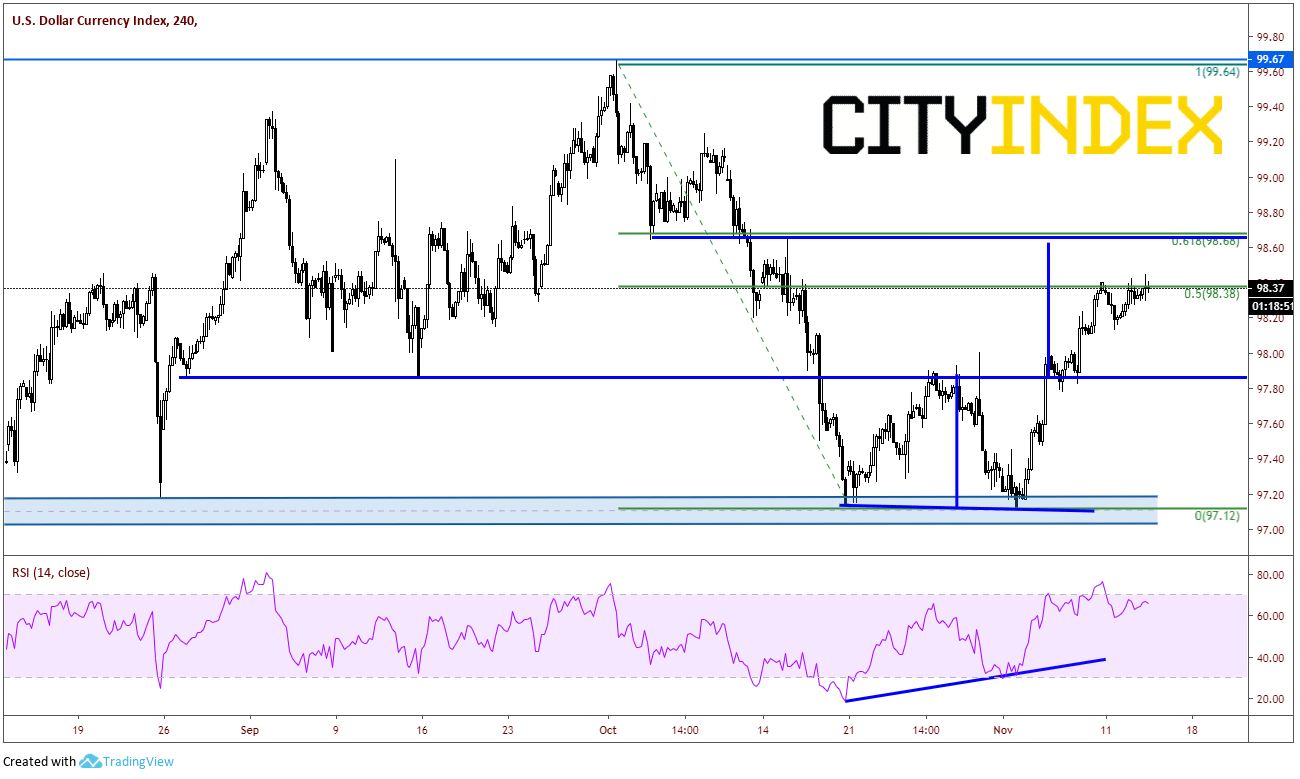
Source: Tradingview, City Index
Watch for the text of Powell’s statement to be released before the actual testimony. The Question and Answer session to follow will most likely be just as important as the text itself!
Latest market news
April 25, 2024 03:09 PM
April 25, 2024 03:00 PM
April 25, 2024 01:12 PM
April 25, 2024 11:14 AM
Latest Dollar articles

April 23, 2024 11:09 PM
April 18, 2024 06:20 AM

February 16, 2024 11:30 AM

February 7, 2024 03:30 PM