


November 10, 2021 4:46 PM
Yesterday, after US PPI was released at its highest levels since November 2010, PPI turned to CPI and said, “Beat that!” Well, US CPI responded to the challenge and reported its highest level since November 1990! The headline YoY CPI print for October was 6.2% vs an expectation of 5.8% and a September reading of 5.4%, mainly driven my higher energy costs. For the core print, which strips out food an energy, the reading was 4.6% vs 4.3% expected and 4% last.
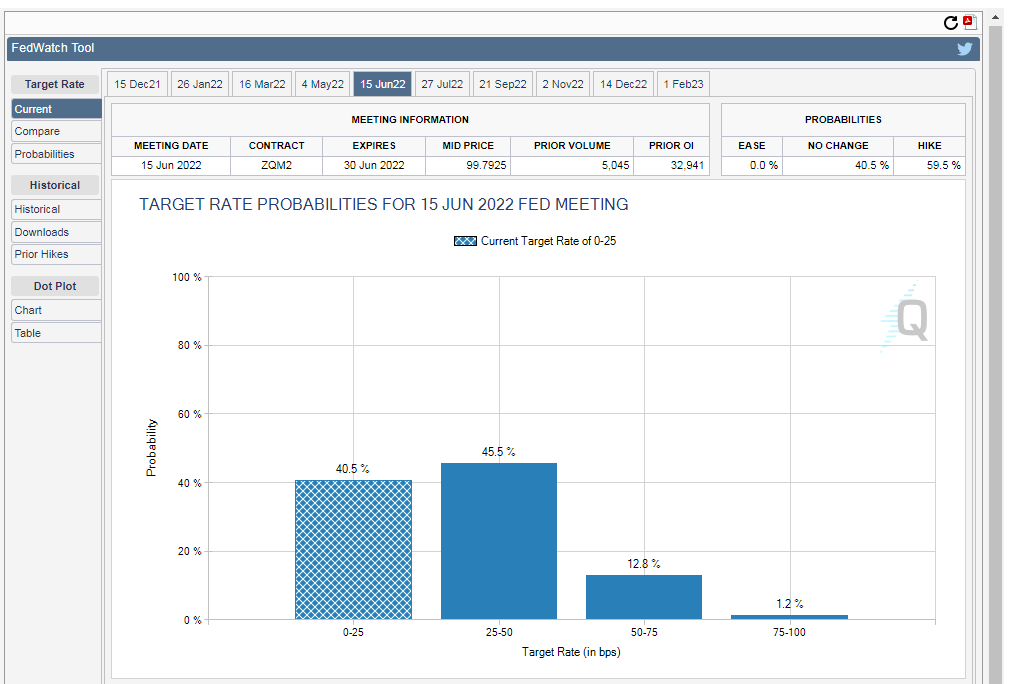
Both readings are much higher than the Fed’s 2% target as traders are left to wonder how much of the inflation is really “transitory”. Traders also need to question how much of this inflation will have an impact on the overall economy. Moments after the CPI print, markets moved to pricing in a near 46% chance of a rate hike in June 2022.
Source: CME, Stone X
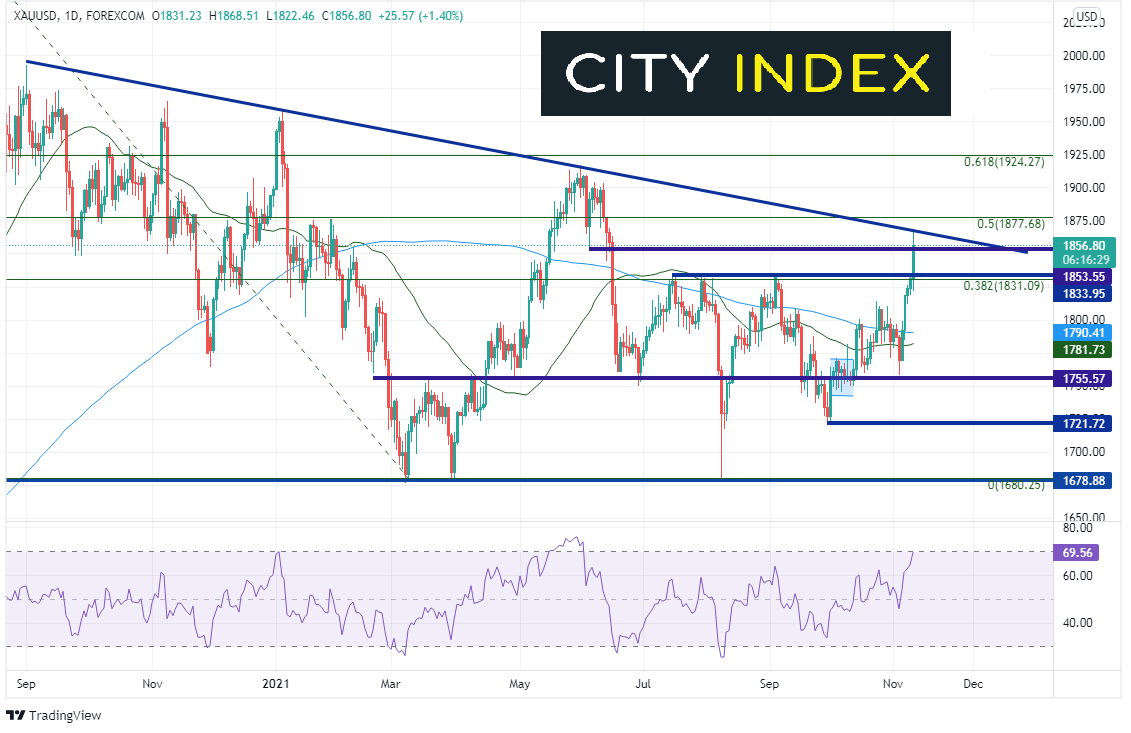
Gold (XAU/USD) has been moving higher over the last 4 days. After the release of the CPI print, Gold sprinted even higher, ripping through previous highs and the 38.2% Fibonacci retracement, from the August 2020 highs to the August 2021 lows, to its highest level since June 17th. Gold also broke through prior lows at 1853.55 as well. The next resistance is at the downward sloping trendline dating back to September 1st, 2020 near 1869 and then the 50% retracement from the previously mentioned high at 1877.68.
Source: Tradingview, Stone X
Trade Gold now: Login or Open a new account!
• Open an account in the UK
• Open an account in Australia
• Open an account in Singapore
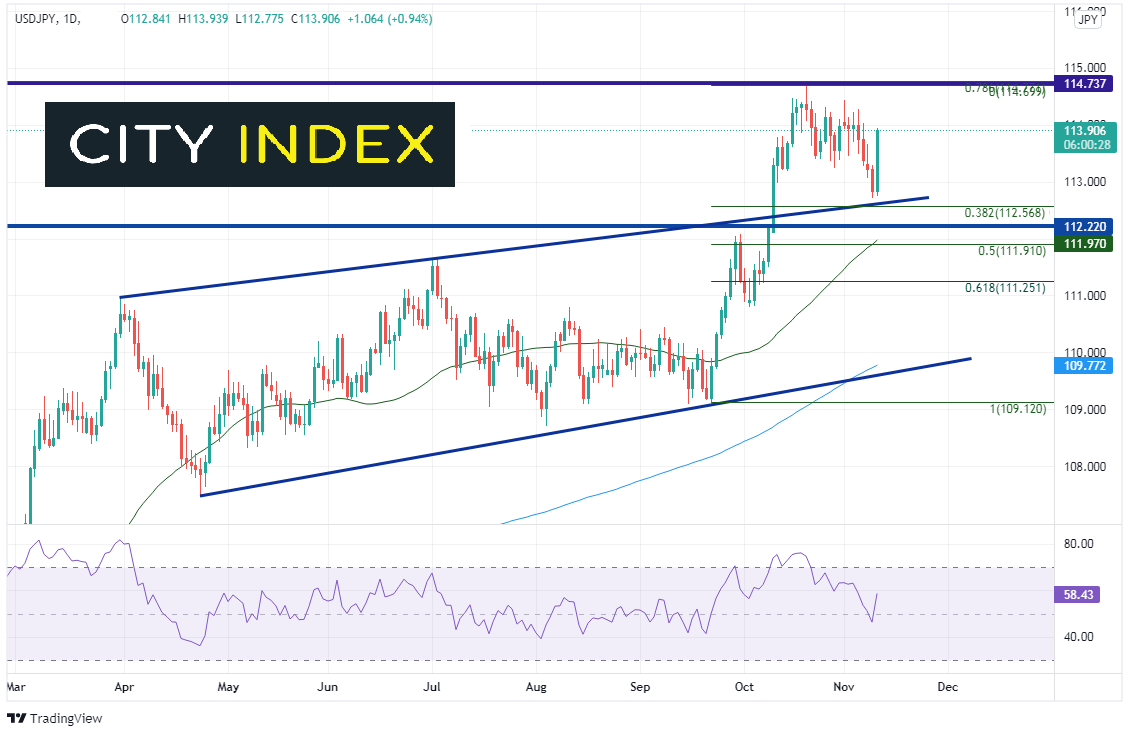
As gold moved higher, so did USD/JPY and the DXY: exactly as one would expect from a higher inflation reading. USD/JPY bounced off the support level we had discussed yesterday, near the rising trendline and the 38.2% Fibonacci retracement level from the September 22nd lows to the October 20th highs. Next resistance is at the October 20th highs of 114.75.
Source: Tradingview, Stone X
Trade USD/JPY now: Login or Open a new account!
• Open an account in the UK
• Open an account in Australia
• Open an account in Singapore
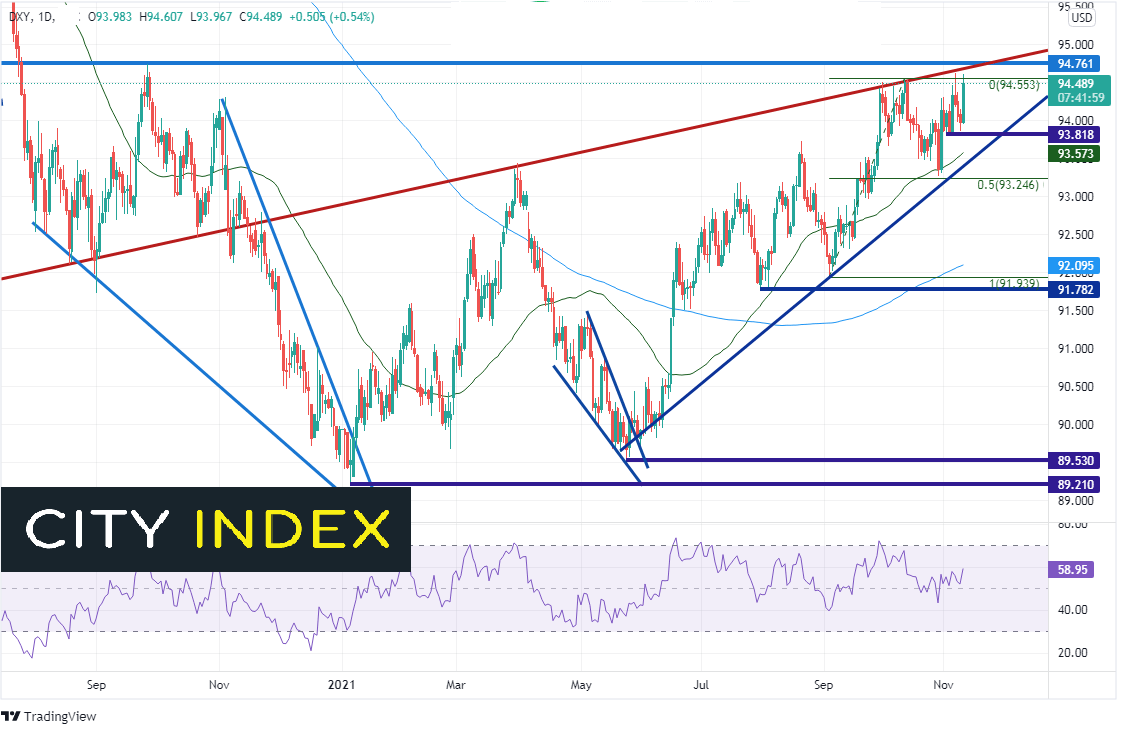
The US Dollar Index (DXY) is also testing new yearly all-time highs. The previous high from November 5th was 94.62. Today’s high thus far is 94.60. There is immediate resistance above at the upward sloping trendline dating back to 2011 (red) near 94.70, just ahead of horizontal resistance from September of last year at 94.76. First support is down at the November 2nd lows of 93.18, then the 50 Day Moving Average at 93.57, followed by a convergence of an upward sloping trendline, the October 28th lows, and the 50% retracement from the September 3rd lows to the October 12th highs at 93.25.
Source: Tradingview, Stone X
CPI and PPI are only 2 indicators the Fed uses to measure inflation. However, if these readings continue to come in stronger than expected, the inflation-hedge assets should continue to move higher, which may also send stock indices lower!
Learn more about forex trading opportunities.
Latest market news
Yesterday 03:00 PM
Yesterday 01:12 PM
Yesterday 11:14 AM
Yesterday 08:28 AM
April 24, 2024 03:30 PM
Latest Trade Ideas articles
Yesterday 03:00 PM
Yesterday 11:14 AM
April 24, 2024 11:00 AM
April 24, 2024 08:15 AM