
February 25, 2022 4:28 PM
The US released a host of data of Friday morning, the most important of which was the January reading of the core personal consumption expenditure price index (Core PCE). The headline PCE Price Index was 6.1% YoY vs 5.9% YoY expected and 5.8% YoY in December. However, it is the Core PCE that the Fed cares most about. That reading was 5.2% YoY vs and expectation of 5% YoY and 4.9% YoY in December. This is the highest reading since July 1982! It should also be noted that Personal Income and Personal Spending were stronger than expected.
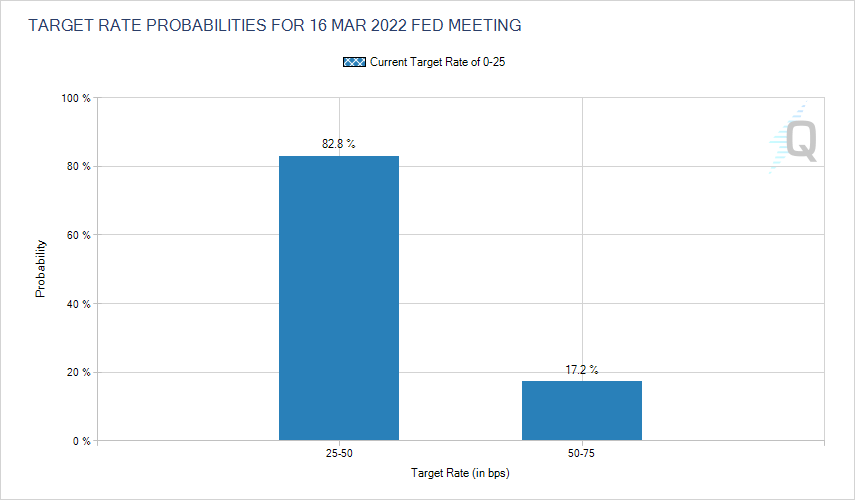
That pretty much cements inflation as “high”, given that the Fed targets 2% for inflation. Could the Fed hike 50 bps at the next meeting on March 16th? St Louis Fed President sent the markets into a tailspin a few weeks ago as he noted that he sees a 100bps hike by July 1st, which would indicate a 50bps at one of the meetings prior to then, or an inter-meeting hike. Expectations have since calmed, however yesterday Fed’s Waller said that he believes the target range should be between 1.00% and 1.25% by early summer and that the Fed should begin to unwind its balance sheet no later than its July meeting. In addition, Fed’s Bowman yesterday also gave some hope for a 50bps hike by noting that the Fed could hike rates at a faster pace than in previous cycles due to high inflation. According to the CME’s Fedwatch tool, markets are currently only pricing in a 17% chance of a 50bps hike in March. (Early in the month, the market was pricing in nearly a 100% chance!) It should be noted that chances of a 50bps increase may have decreased due to the uncertainty surrounding the Russia/Ukraine situation.
Source: CME
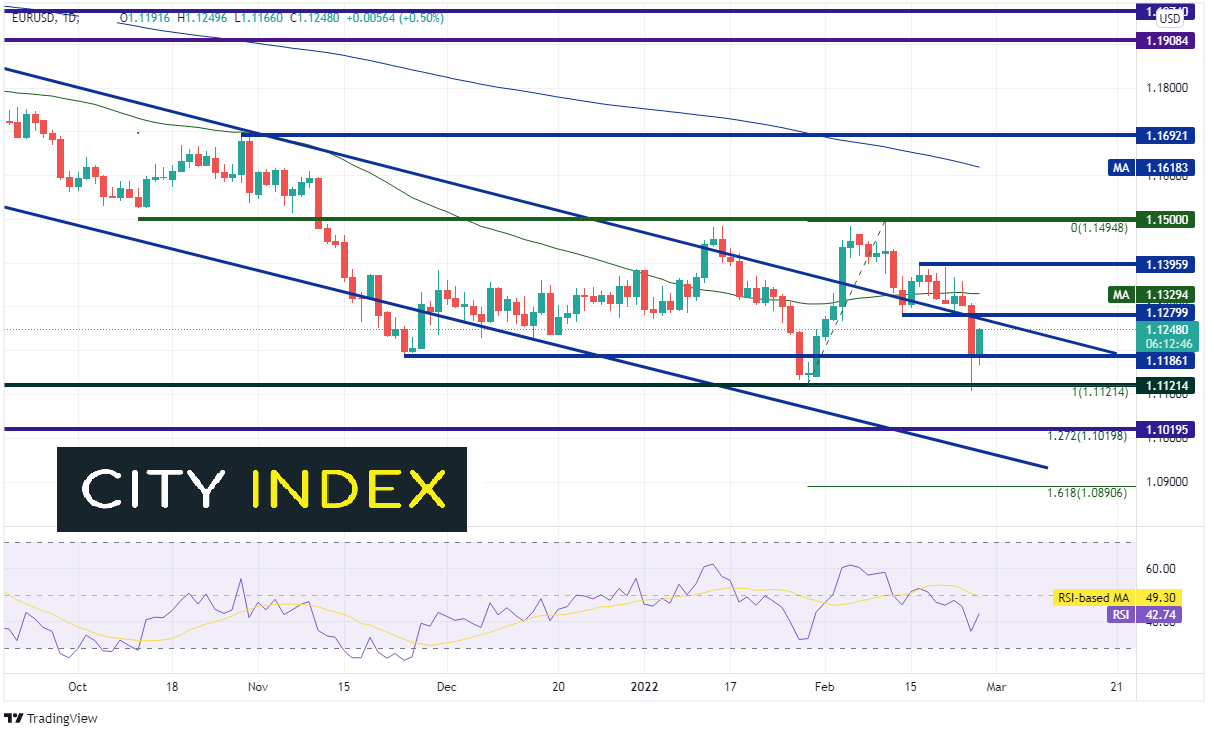
Although EUR/USD has been trading in a long-term downtrend, it has been trading in a range between roughly 1.1120 and 1.1500 since November 10th, 2021. Yesterday, with the Russian invasion of Ukraine, EUR/USD tested the bottom of the sideways channel (green) as traders fled to the safe haven of the US Dollar, making a low of 1.1106 before bouncing. However, should the Russia and Ukraine find a resolution to the conflict before the March 16th FOMC meeting, the US Dollar will stand on its own. Support is at yesterday’s low (and the bottom of the sideways channel). Below there is long-term horizontal support at 1.1020. This is also the 127.2% Fibonacci extension from the lows of January 28th to the highs of February 10th. Next is the bottom trendline of the long-term downtrend channel near 1.0970. Should we see signs that inflation has slowed in February before the FOMC meeting, EUR/USD could move higher. Horizontal resistance is at 1.1280, then the 50 Day Moving Average at 1.1329. Above there is a series of recent highs at 1.1296, then the Feb 10th highs near 1.1500 (this is also psychological round number resistance).
Source: Tradingview, Stone X
Trade EUR/USD now: Login or Open a new account!
• Open an account in the UK
• Open an account in Australia
• Open an account in Singapore
Inflation is still blistering according to the Fed’s favorite measure of inflation, Core PCE. Could they hike 50bps at the March meeting? According to Fed’s Bullard, Waller, and Bowman, there is a chance! However, the meeting is nearly 3 weeks away, and a lot can change, especially with the Russia/Ukraine conflict uncertainty. Watch for more inflation data over the next few weeks to get a better clue as to what may happen on March 16th.
Learn more about forex trading opportunities.