


January 15, 2020 11:21 AM
US-China Trade Deal FINALLY Here!!!
Today is the day the United States and China have been preparing for…the day the two countries sign “Phase One” of the US-China trade deal. President Trump and the China lead negotiator for the deal, Liu He, will meet in Washington today to formally sign the deal.
The markets already know what Phase One is all about… primarily, larger agriculture purchases by China from the US in exchange for “some” tariff reductions. China also was un-designated by the US as a currency manipulator. However, as my colleague Matt wrote about earlier, tariffs are expected to remain in place. What does that mean for the stock markets and the fx markets moving forward? There have been comments and speculation that “Phase Two” of the deal may not begin to after the US Presidential election in November. As such, the markets may be left in limbo until the election.
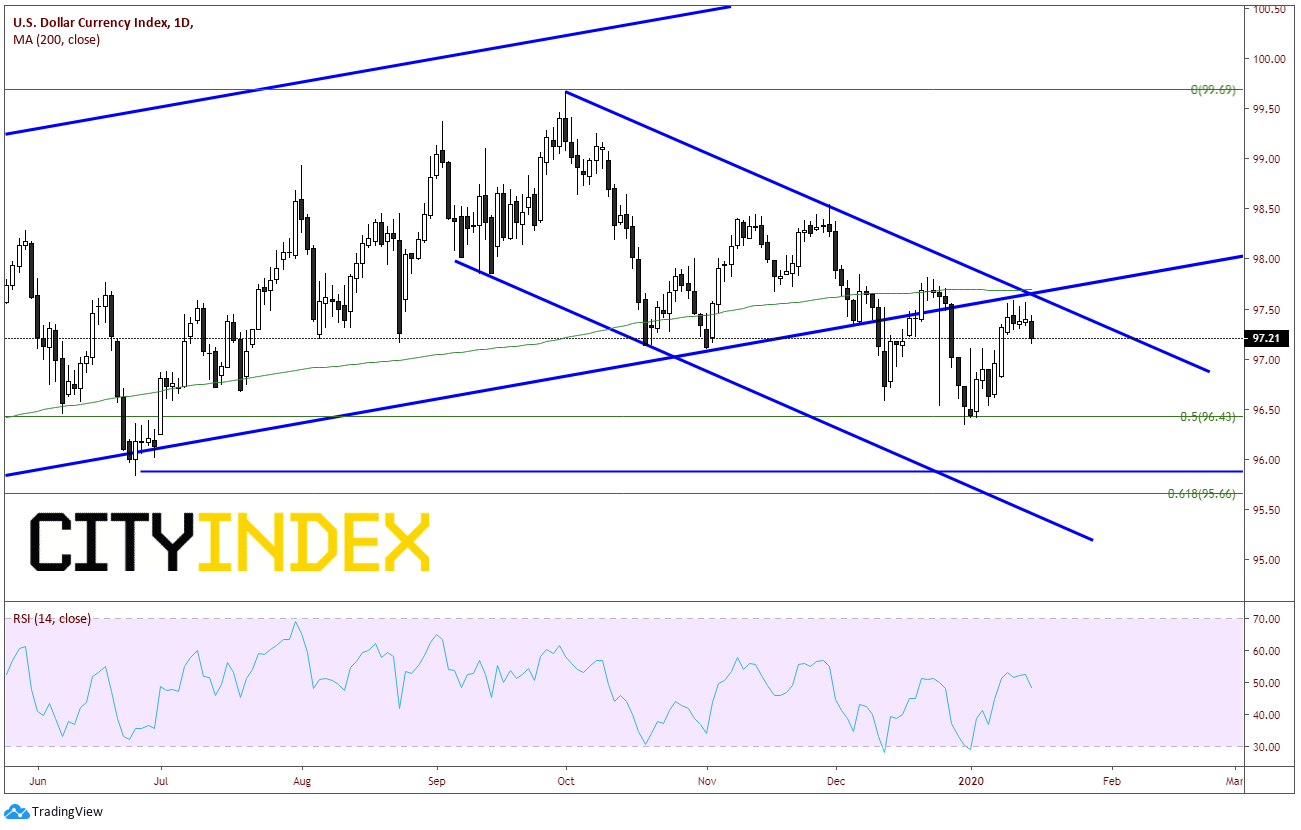
Yesterday, when discussing the CPI data we addressed the DXY. We noted how there was a confluence of resistance and it was that it was decision time for the DXY. It is not a surprise that this coincided with the signing of the trade deal, as markets are deciding what to next. If the uncertainty of the trade deal is out of the way and China is longer a “currency manipulator”, one would the value of the US Dollar to weaken as the Chinese Yuan strengthens.
Source: Tradingview, City Index
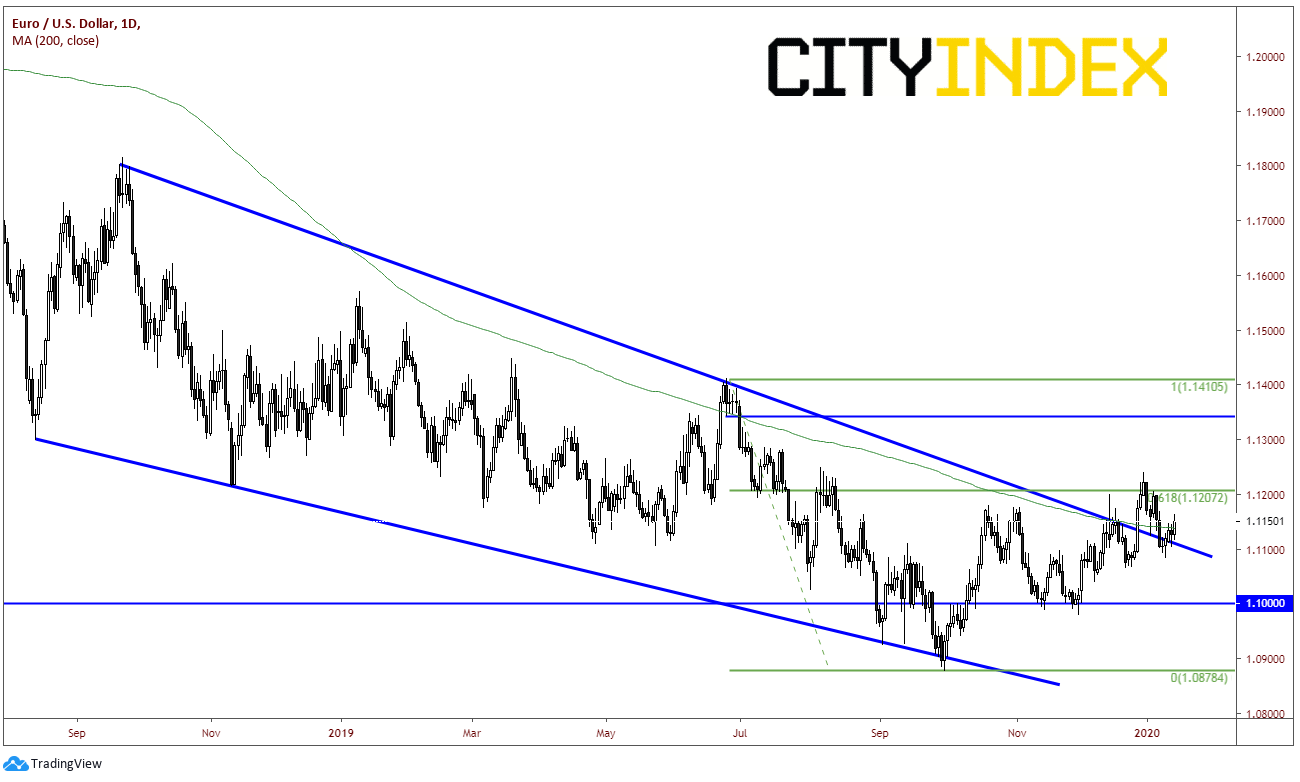
Today the DXY is moving lower, as it could not push through this resistance level. As a result, EUR/USD is pushing higher, back above the downward sloping trendline of the long-term wedge price has been in since the second half of 2018, near 1.1150. The 200 Day Moving Average also comes in near this level at 1.1139.
Source: Tradingview, City Index
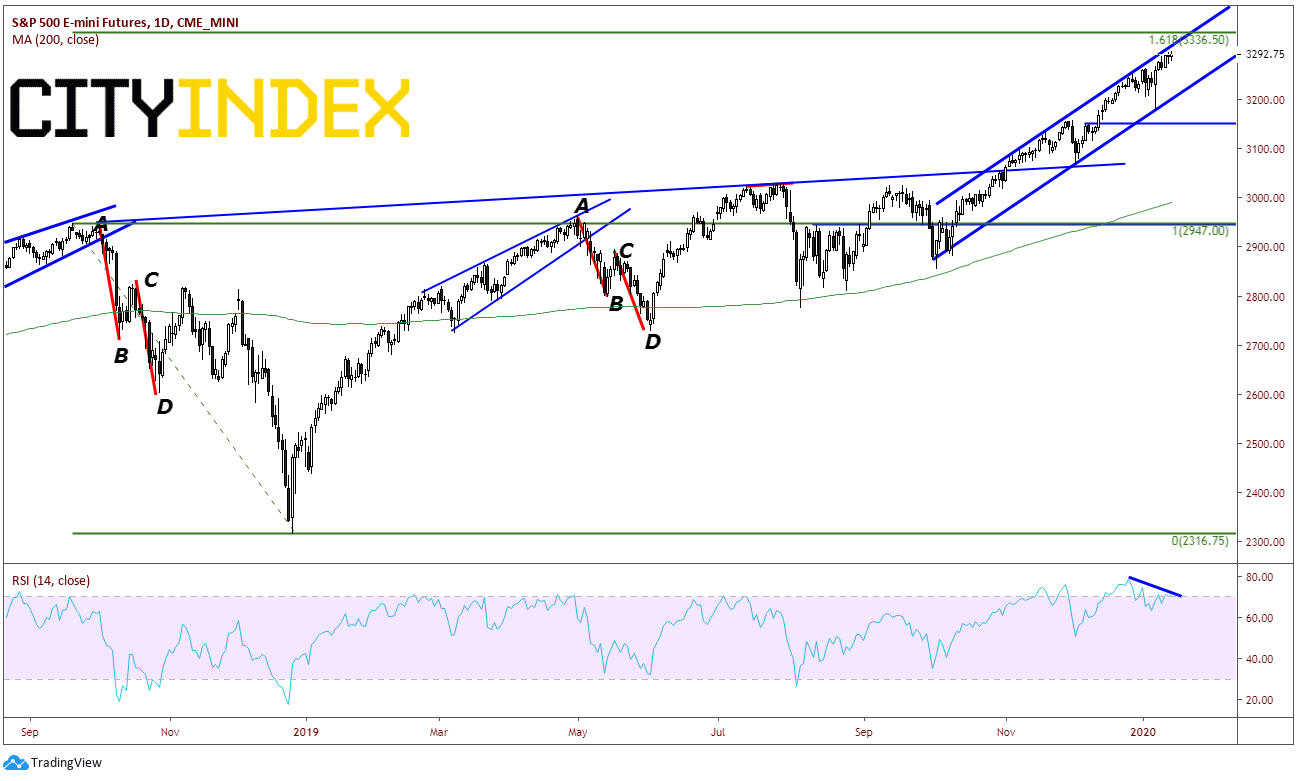
The S&P 500 has been moving in an upward sloping channel since early October 2019, and continues to put in new all-time highs, currently near 3300. But one should consider today’s signing could be a “buy the rumor, sell the fact”, as price is currently near the top of the upward sloping trendline of the channel, as well as, the Golden Fib level of 161.8% retracement of the move lower from Q4 2018 near 3335. In addition, the RSI is diverging from price, an indication of a possible reversal.
Source: Tradingview, CME, City Index
After today, markets will try and figure out “What’s next?”. If data confirms that both the US and China are holding up their ends of the deal, stocks may continue to rise and the DXY may continue lower (with USD/CNH). However, if it is determined either side is not living up to expectations, stocks could head lower and the DXY could be on the rise again.
Latest market news
Latest Dollar articles
Yesterday 06:20 AM
February 16, 2024 11:30 AM
February 7, 2024 03:30 PM
February 2, 2024 02:00 PM