Unilever’s third-quarter sales figures—released the morning after its spat with Tesco came to light—help reveal why the pair have taken the unusual step of airing a major contractual disagreement in public.
Whilst price hikes like the one Unilever is trying to get Tesco to pass on to customers helped soften a slowdown in its key sales, the impact of negative currency movements—particularly from sterling—is clear.
Underlying sales, using constant exchange rates, rose 3.4%, but turnover (at current rates) edged 0.1% lower. Underlying sales growth was 3.2%. Better than a c.3% market forecast, but a big drop from 4.7% in the first half of Unilever’s financial year. Q3 sales also don’t match the consumer giant’s guidance of 3.5% for the full year.
These figures don’t quite dispel our view that the falling out with Britain’s No.1 supermarket is largely a sideshow as far as the group’s annual earnings are concerned: Unilever still looks on track to deliver sector-leading volume growth, operating margin improvement and cash flow.
But the flare up—which has come to be known as ‘Marmitegate’—does show that pressures are building in the consumer sphere following the Brexit vote and they’re likely to persist.
This may help explain why Unilever’s shares slid 2% soon after the market open, despite better-than-expected sales.
(The share fall may also reflect investor displeasure that the fight has gone public; Tesco shares also underperformed the FTSE at the time of writing.)
In this case, supplier Unilever is legitimately trying to offset some of the revenue declines and input cost rises that are a direct consequence of sterling’s collapse over the last few months.
But Tesco, the retailer, is loath to put a 10% jump in Unilever product prices in front of its customers whilst a price war is raging with rivals.
Will Unilever, known in Britain as the maker of the Marmite spread, remain in a huff forever? Of course not.
It makes no business sense for one of the biggest health & consumer care groups in the world to keep its goods off the shelves of Britain’s biggest retailer, and we expect common sense to prevail within days.
We expect the impact of the groups’ dispute on their share prices to moderate very soon as well.
However, we expect similar conflicts between suppliers and High St. names to come to light in the near term, as the weak pound threatens margins further.
Medium-sized British consumer goods manufacturers, whose revenues are not shielded by huge overseas sales—like Unilever’s—will be more vulnerable.
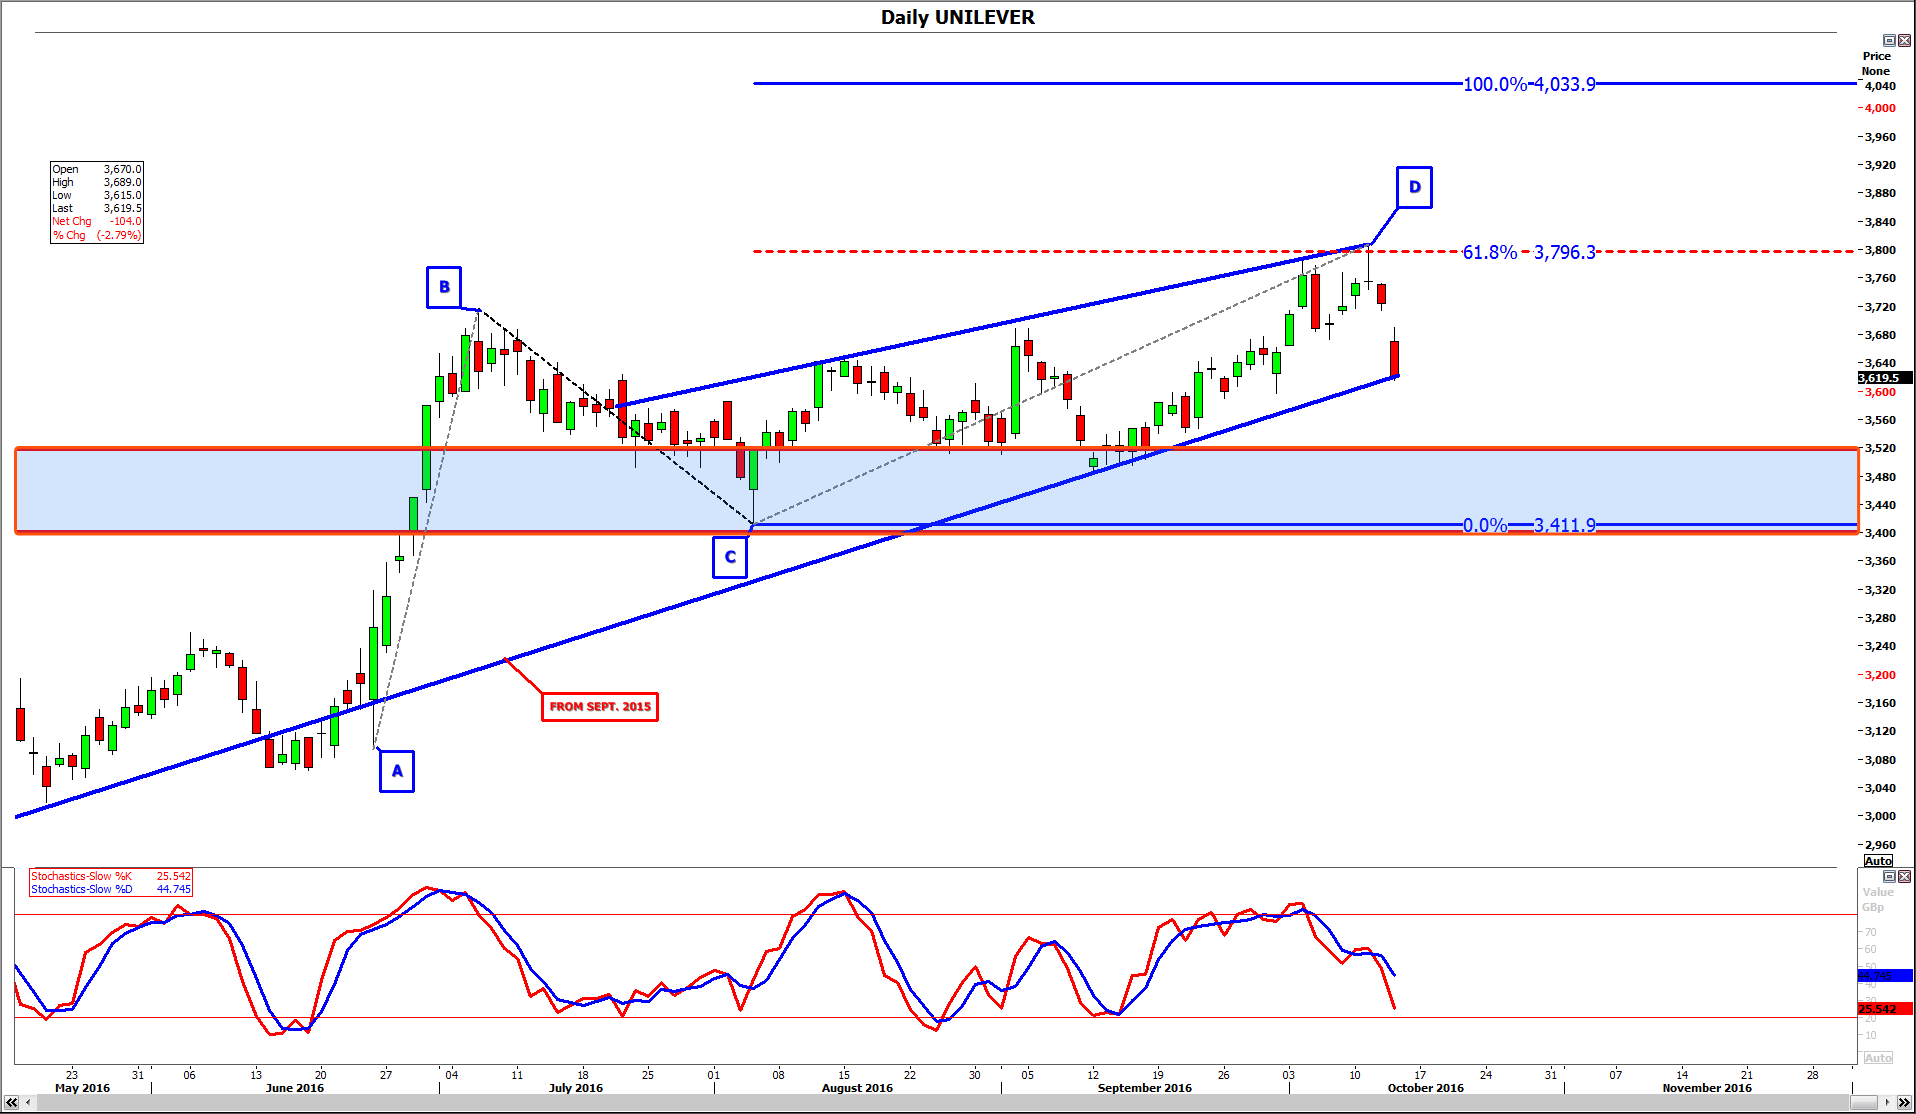
Unilever’s technical chart underscores investor wariness about current economic pressures on the group, despite its ability to damp these by dint of sheer scale.
Its London shares demonstrate a clear rising trend since September 2015.
However a surge higher that began a day after the Brexit vote–part of a defensive swing by big investors as they fled riskier sectors like banks—came to a halt in July as inflationary pressures emerged.
Following a subsequent attempt, beginning in August, to recoup the decline, the stock has now completed an A-B-C-D pattern at a price (3796.3p) that is equivalent to 61.8% (an important Fibonacci number) of the initial June-July move (‘A’ to ‘B’).
Classically, bearish traders would be inclined to sell at point ‘D’, looking for a retracement that could be as deep as the price of point ‘C’.
One major refinement in Unilever’s chart is the rising wedge visible since late-July.
Whilst it too can be a bearish sign at the point of convergence between upper and lower lines, before that confluence occurs, the supportive effect of the lower bound of the channel can remain intact.
Given Unilever shares are currently at that support, only a move below the short-term rising trend will validate the bearish scenario.
A support band visible between c. 3400p-3520p could also yet enable the shares to maintain their long-run gaining trend.
A breach, however, would call for a return to, or near, the price where the summer’s rally began, 3094p.
DAILY CHART
Please click image to enlarge
