


As European investors show the most buying interest in UK shares for years, here are the stocks with the best—and worst—chances of strong gains, according to technical indicators
Context
The skies may be brightening for UK shares. Or at least investors are beginning to think so. A Bank of America Merrill Lynch survey of fund managers from earlier this month showed a net 9% of EU investors intended to overweight British equities, the highest in 5 years. Likewise, Morgan Stanley called British stocks “potentially the best global equity opportunity for 2020”, based on a view that hard-Brexit risks are fading fast, though only after battering relative UK stock market valuations to 30-year lows. Reduced bearish sentiment on chronically unloved UK shares also reflects better prospects that Britain could unsnarl its convoluted Brexit process. Improved global risk appetite on hopes for trade de-escalation helps as well.
Risks are hidden in plain sight, of course. See the recent stock market swings as prospects of a ‘phase one' deal have waxed and waned. For the FTSE 100, a slide in dividend growth to a fraction of the global average in Q3 may not bode well for sustained net inflows either. Still, we assume investors will tend to seek the best opportunities, even in a limited window of improved sentiment. So we decided to create a ‘screen’ of technical chart indicators with the aim of sifting out stocks with the most and least favourable near-term outlooks.
Methodology
- Universe: FTSE-All Share Index which includes FTSE 100, FTSE 250 and FTSE Small Cap stocks, totalling 628
- 18 technical studies applied in weekly intervals between 18th October and 18th November
- A selection of the studies: Bollinger Bands, Directional Movement Index, MACD, Relative Strength Index, stochastics, short/long-term moving averages, Average True Range, William's %R, Exponential Moving Average
- Bullish signals scored 1, bearish signals -1. Scores were totalled and stocks ranked according to score
- Scope was managed by selecting the top-40 and bottom-40 ranked equities
- For sector classification, we adopted a combination of the Industry Classification Benchmark and Bloomberg’s BICS (link opens a PDF). Using both allowed a good balance between a system that was sufficiently descriptive but with broad enough categories to spot trends
Things to remember when looking at these results
- Technical analysis is backward looking. Strictly speaking, it tells us nothing about future price action
- We assume that as a snapshot of current conditions, technical indicators can offer clues about what might happen in the near future
- Technical analysis is mostly a tool for interpreting current and recent price action
- Technical indications may turn out to be misleading in practice. Note our methodology hasn’t been back tested
Key points from the results: Sectors
- The general impression conveyed by the results was that so-called ‘value equity sectors’ (as opposed to ‘growth equity sectors’) were favoured. In other words, within the UK stock market, higher-yielding though relatively stable stocks are being favoured by investors over faster-growing less stable shares
- The most frequent equities to emerge, even in our pared back selection were Investment Funds and similar vehicles. There are almost 190 such entities in the FTSE All-Share. The majority received a positive score in our screen. This gels with BofA Merrill’s finding of rising demand for exposure to UK stocks. But funds appeared among both positive and negative ranks. This denotes active selection within the UK market. Because of time constraints and limited space, we won’t go into further detail about funds. In any case, trends are easier to spot from single-stock sets than funds. On that basis, listed funds were removed from our finalised list, but distinct companies that operate funds were kept
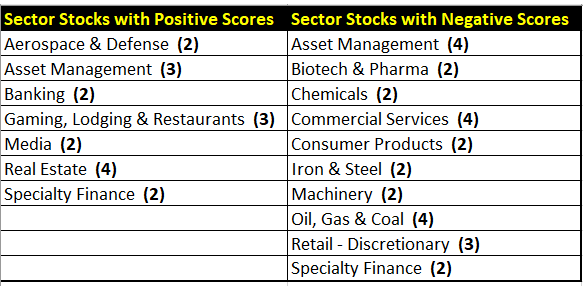
Here is a breakdown of sectors/industries that were highlighted most frequently
Source: Bloomberg/City Index
- As hinted at earlier, careful attention needs to be paid to sector classifications. Some classifications may mask more specific trends. For instance, Barratt Developments obtusely is classified under Home & Office products under BICS, though is more usefully categorised as a property share. Similarly, online takeaway firm Just Eat manages to be classified as a media firm
- Generally though, 5 separate Property shares point to a clearly defined appetite for the sector. Incidentally, property shares, which are thought to be amongst the most sensitive to Brexit fallout, have often reacted sharply to news linked to Britain’s EU departure. However, it’s worth stressing that residential property shares have continued their long-term outperformance since Britain voted to leave the European Union in 2016
- The Oil & Gas sector is a stand out with negative pointers. Three exploration & production firms - Petrofac, Shell and Tullow - and one oilfield services company – Hunting scored minus points
- Retail/Discretionary is another prominent segment with unfavourable indications, including Marks & Spencer and Dixons Carphone
- Asset Management was indicated for both upside and downside simultaneously. Again, this suggests purposeful selection, underscoring revived interest in UK equities
- So-called ‘Gaming, Lodging & Restaurants’ shares appeared 3 times. On closer examination, the stocks comprise one online gambling operator – 888 Holdings Plc – and two pub/restaurant groups – Wetherspoon and Restaurant Group
- The main takeaway from sectors appearing with high frequency is that almost by definition, only a handful of stocks were pinpointed. For that reason we are inclined to see the positive indications as being stock-specific, or at least due to narrowly applicable reasons. Overall, we’re more confident to spotlight a preference for the investment style (‘value’) rather than preferences for specific sectors
Key points from the results: Individual shares
- With consensus upside and downside provided in the complete tables below, it’s possible to spot some shares with positive technical indications that have been rank underperformers in the year to date, and vice versa
- From a mean-reversion perspective, recent positive signals following underperformance may provide a basis for strong recovery. One example is specialist insurer, Just Group (formerly known as Just Retirement). It has fallen 33% in 2019 but its consensus target price points to 61% upside. Note that consensus target prices do not always agree with the direction suggested by the technical screen
- The obverse of the above may also apply: recent negative signals following outperformance may provide a basis for marked declines
- Large-cap vs. small cap shares: only a minority of large-cap names were highlighted on the bullish or bearish side. Among the former, Anglo American, AstraZeneca, BAE and RBS were the highest-valued firms to receive positive scores. Big stocks with negative scores included, Shell, BHP and Unilever. At £8.5bn, Burberry is the smallest stock by market value that could be considered a ‘large cap’. Still, it’s among the highest-rated stocks in our screen, so warrants a close look. The luxury retailer beat expectations with a solid first-half, despite disruption in its key Hong Kong market
- Generally, we have treated the precise score/rank accorded to any given stock as not very significant on an aggregate basis
- However, the score is likely to be of interest on an individual stock basis
- Perhaps, when more than one stock was highlighted in the same sector, the stock with the highest score, should be favoured most, and vice versa for negatively-scored shares
- We intend to examine individual stocks with strong positive and negative scores in separate articles in coming days and weeks
Shares with positive scores (ranked) – 18th October 2019 to 18th November 2019
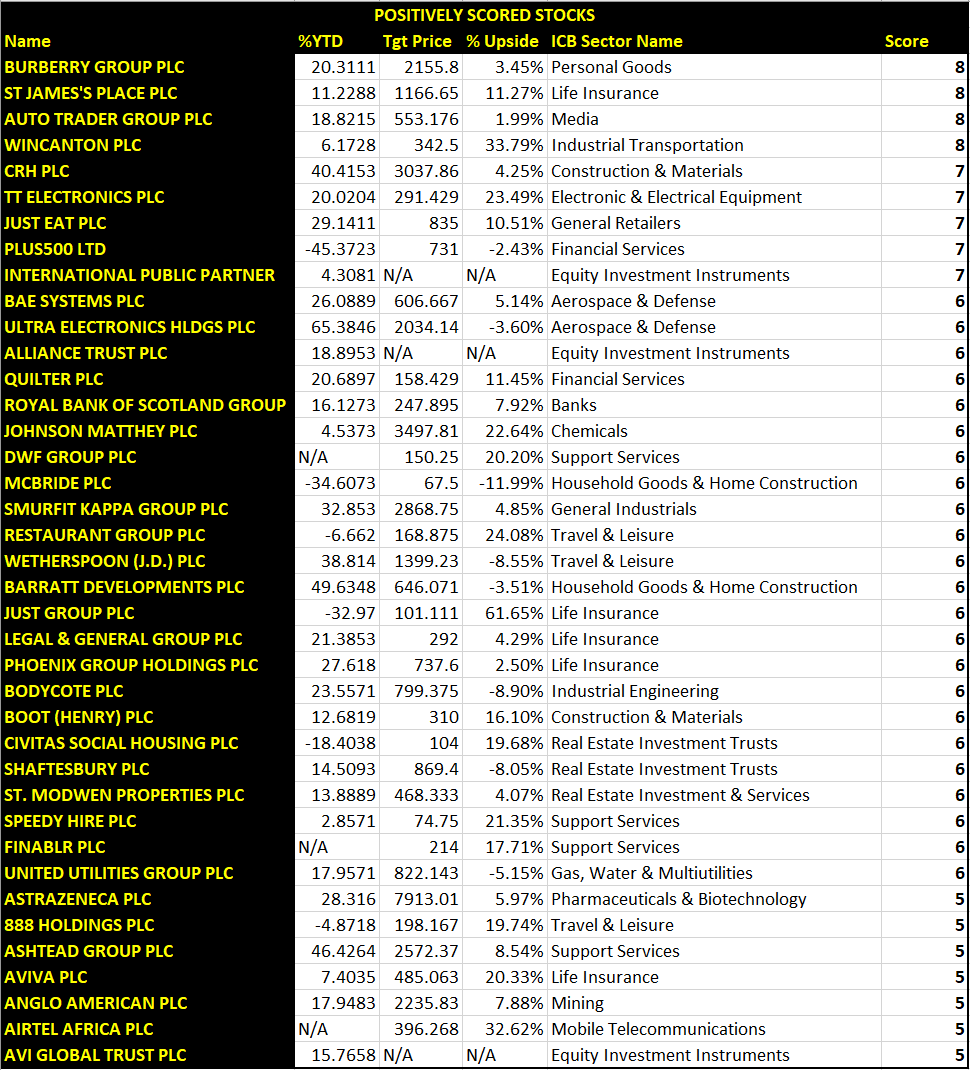
Source: Bloomberg/City Index
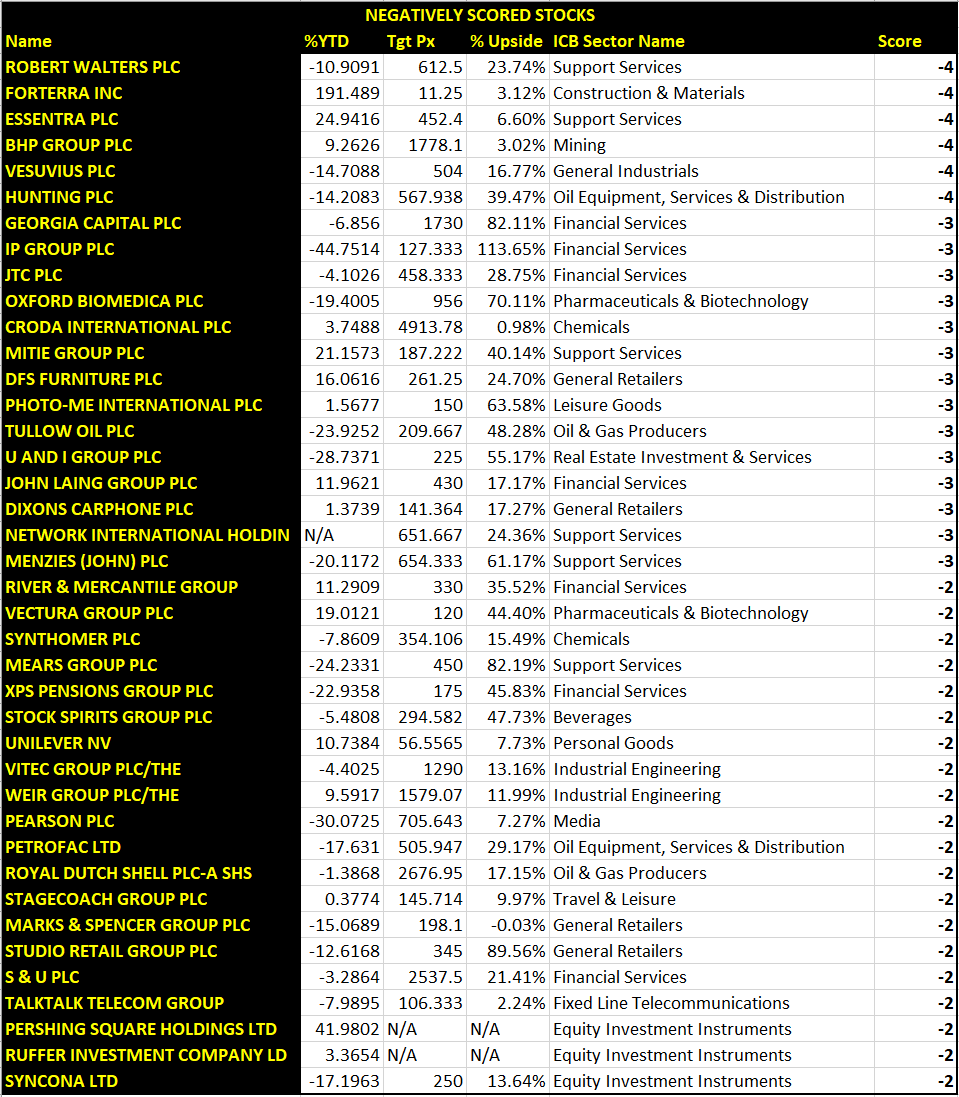
Shares with negative scores (ranked) – 18th October 2019 to 18th November 2019
Source: Bloomberg/City Index
Key takeaways/re-cap
- The most compelling takeaway in our view, is that technical indicators strongly point to a ‘value investing’ style as more favoured than ‘growth’, ‘momentum’ or other investing styles
- Investment funds and similar vehicles were the equities investors opted for the most to express both positive and negative views on the stock market outlook
- Oil stocks, and specialised commercial services groups came out worst in the technical screen; a small cohort of retailers also received the thumbs down
- Property was the sector with the most frequent bullish indications in our study
- Mid-cap shares were highlighted more than stocks with the largest market value, though among the latter, Anglo America, Burberry and RBS were ranked highest
Latest market news
Latest Shares market articles
November 2, 2023 01:41 PM
November 1, 2023 01:33 PM
October 31, 2023 01:15 PM
October 31, 2023 10:24 AM