


What to expect:
UK banks are due to report Q3 results amid rising expectations of a rate hike from the BoE in the coming months. Additionally, after impressive numbers from US banks last week, expectations are running high.
BoE to raise interest rates?
The BoE slashing interest rates at the start of the pandemic has hit Net Interest Income at the banks. This has been felt across all banks but particularly at Lloyds & NatWest given their focus on high street lending. However, expectations are rising that the BoE could move to raise interest rates as soon as next month. The CME Group BoE watch tool points to a 70% probability being priced in of a rate rise in the December meeting. This of course is good news for the banks. When interest rates are higher banks are able to expand their profit margins, charging higher rates on loans. Furthermore, the broad expectation is that the higher UK borrowing costs shouldn't derail the economic recovery given strength in the jobs market and pandemic savings.
Deal making
We saw in the US that the banks outperformed largely thanks to surging revenue from deal making and M&A activity amid a boom in global M&A deals in the third quarter. This Is likely to boost revenue at HSBC and Barclays thanks to their strong investment banking division.
Costs
Rising costs were at concern as US banks reported and that concern is likely to be replicated with US banks. Competition with fintech stocks are driving up tech costs at the banks and could prove challenging to rein in.
However, it is also worth remembering that banks are less exposed to supply chain disruptions and inflation than other sectors. A solid set of numbers combined with expectations of a rate hike could see bank stocks drive higher.
Learn more about how to read earnings reportsIn more detail:
Barclays 21st October
Recently Barclays upwardly revised its Net Interest Income (NII) for the full year in an encouraging move. This is upbeat sign of things returning to normal. It stemmed from consumers taking longer to pay off their credit card balances than they did during covid. Looking to US banks for inspiration, the Wall Street giants have been releasing bad loan provisions which they had put aside last year in case customers defaulted, which helped profits considerably. Expect to see a similar move over here. Finally, Q3 has seen a boom in global deal making and M&A activity the investment back division will be under the spotlight.
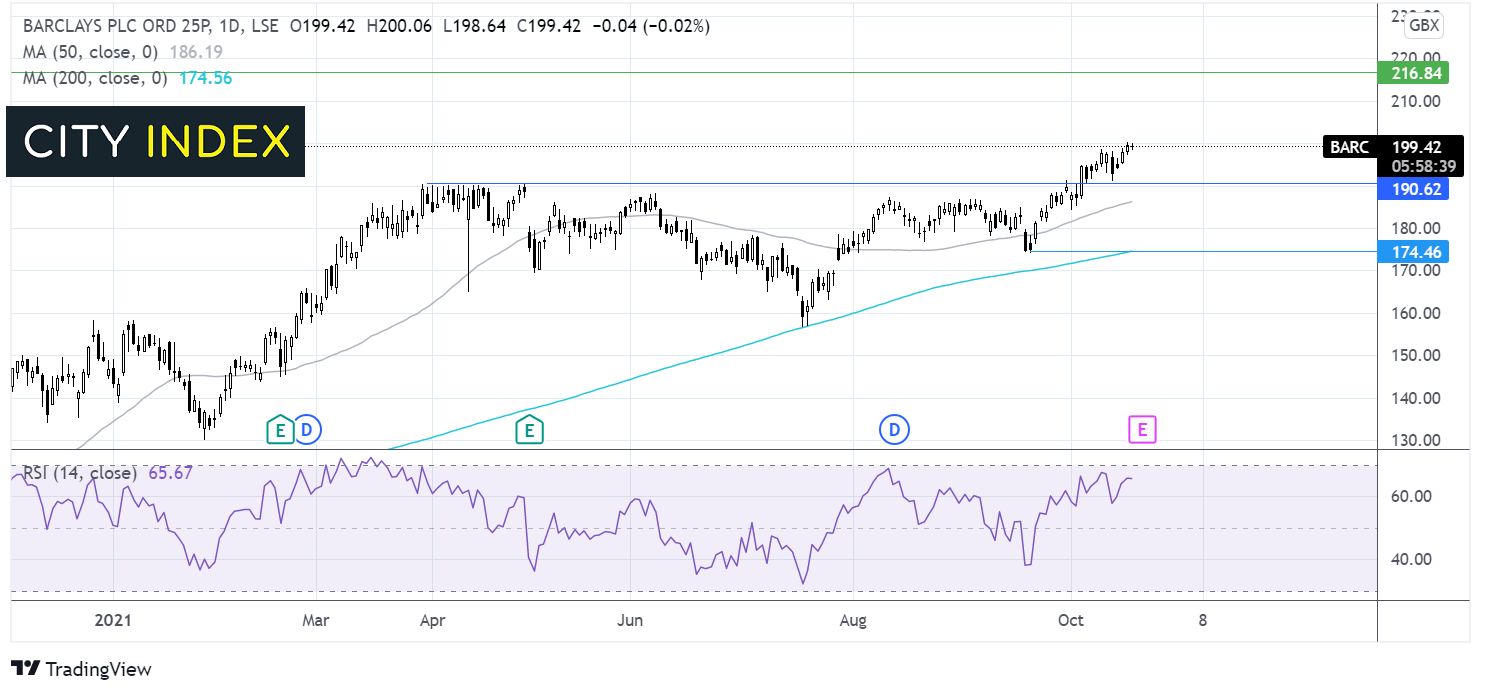
Where next for Barclays share price?
Barclays share price has recently broken out pushing beyond 190p a level which has capped gains across most of the year. The RSI is above 50 but below 70 and supportive of further gains. Beyond 200p psychological level buyers could look to target 215p a high from April 2018. On the flip side, a fall below 190p could negate the near-term uptrend. It would take a move below 17p the September low and 200sma for the bears to turn the bias.
HSBC 25th October
Conflicting relations between the West and China are a key challenge for the bank as it continues it pivot towards Asia and have helped keep the share well below pre-pandemic levels. In May the bank exited from the US and in June announced its plan to dispose of the French retail business. Cost cutting continues on a large scale which has helped financial results stabilise. Whilst CEO Noel Quin is making good moves, the results could take years. Still, with a large investment banking arm HSBC is likely to have benefited from the global boom in deal making. Costs are likely to remain elevated. Investors will be keen to see what the impact from Evergrande has been.
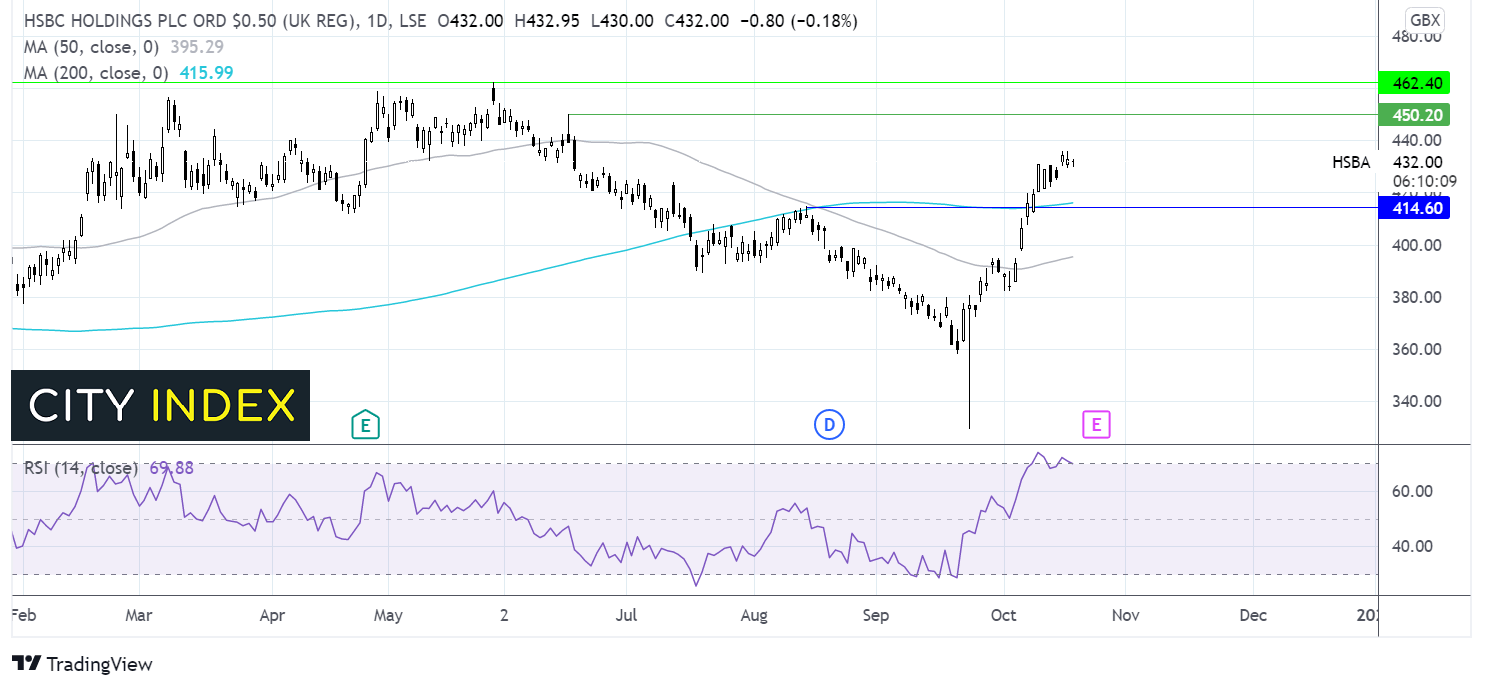
Where next for HSBC share price?
HSBC has been extending gains after rebounding off 320p in late September, pushing over the 50 & 200 sma. The RSI is teetering on overbought so there could be some consolidation around these levels. Buyers will keep aiming for 450p whilst it would take a move below 414p the 200sma and horizontal support to negate the near-term uptrend. A move below 394p is needed for sellers to gain traction.
Lloyds October 28th
Lloyds share price has rallied around 35% so far this year as it heads into Q3 earning. Strong earnings in the first quarter helped to lift the stock price. However, the absence of a buyback announcement in July disappointed. The recent rally in Lloyds comes as the BoE is expected to raise interest rates sooner than previously expected. Higher rates would boost NII, lifting profitability. Lloyds is set to be one of the biggest benefactors from higher interest rates given its focus on lending & mortgages. The cheapest mortgages have already been pulled from the market in anticipation of higher rates. As with other banks costs will be in focus, particularly surrounding investment in technology.
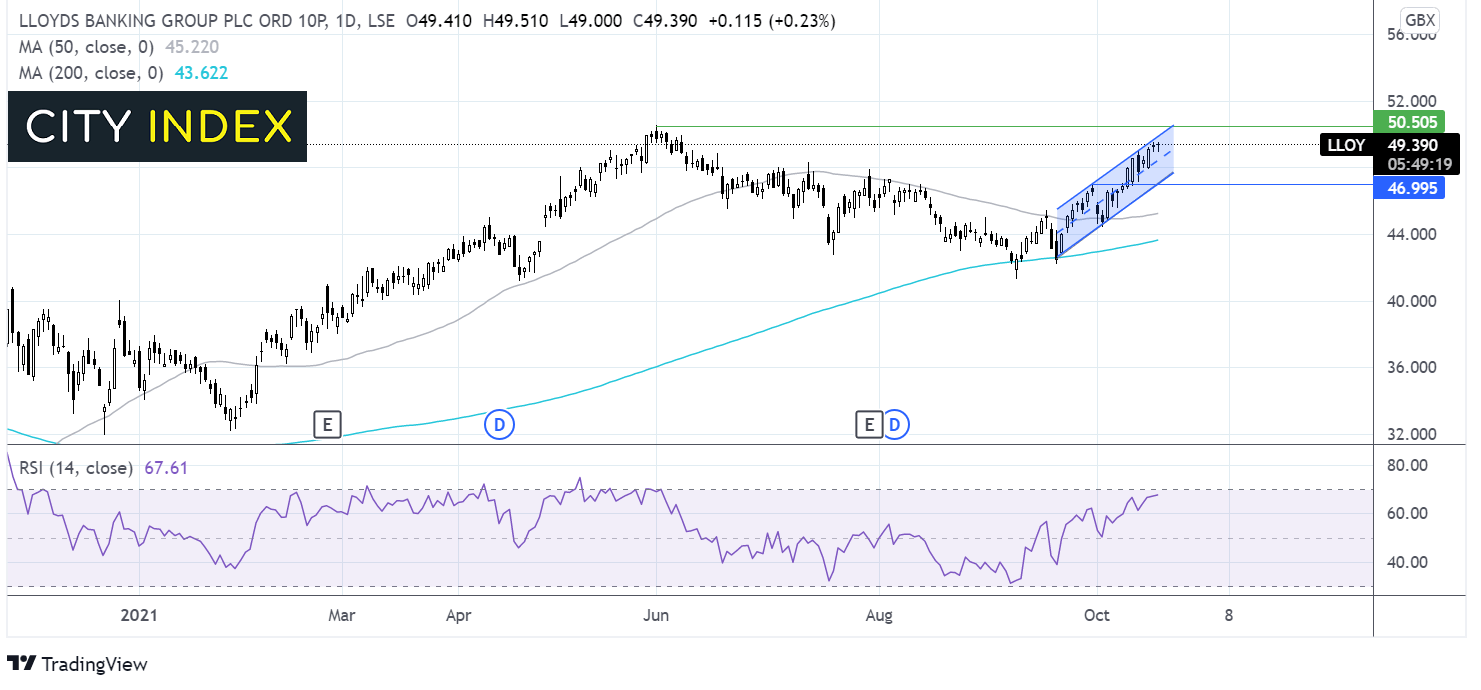
Where next for the Lloyds share price?
Lloyds share price rebounded off the 200 sma at the end of September. It trades within an ascending channel, towards the upper band. The bullish RSI is supportive of further upside whilst it remains out of over bought territory. Bulls will be targeting 50.56 the year to date high and the upper band of the rising channel. It would take a move below 47p the September high to negate the near-term uptrend.
NatWest 29th October
NatWest will release Q3 results under the cloud of further regulatory issues. The bank which is still 55% owned by the taxpayer pleaded guilty for failing to prevent alleged money laundering between 2012 – 2016. The FCA could fine the bank up to £340 million for the charges. The share price has scaled back to pre-pandemic levels thank to sold H1 numbers. The bank swung into a £2.5 billion profit compared to a £770 million loss the previous year. Investors will be looking to see whether the momentum has been maintained. That said underlying trends were slightly weaker than Lloyds & Barclays which is worth keeping an eye on. With the digital transformation is full swing costs will also be key.
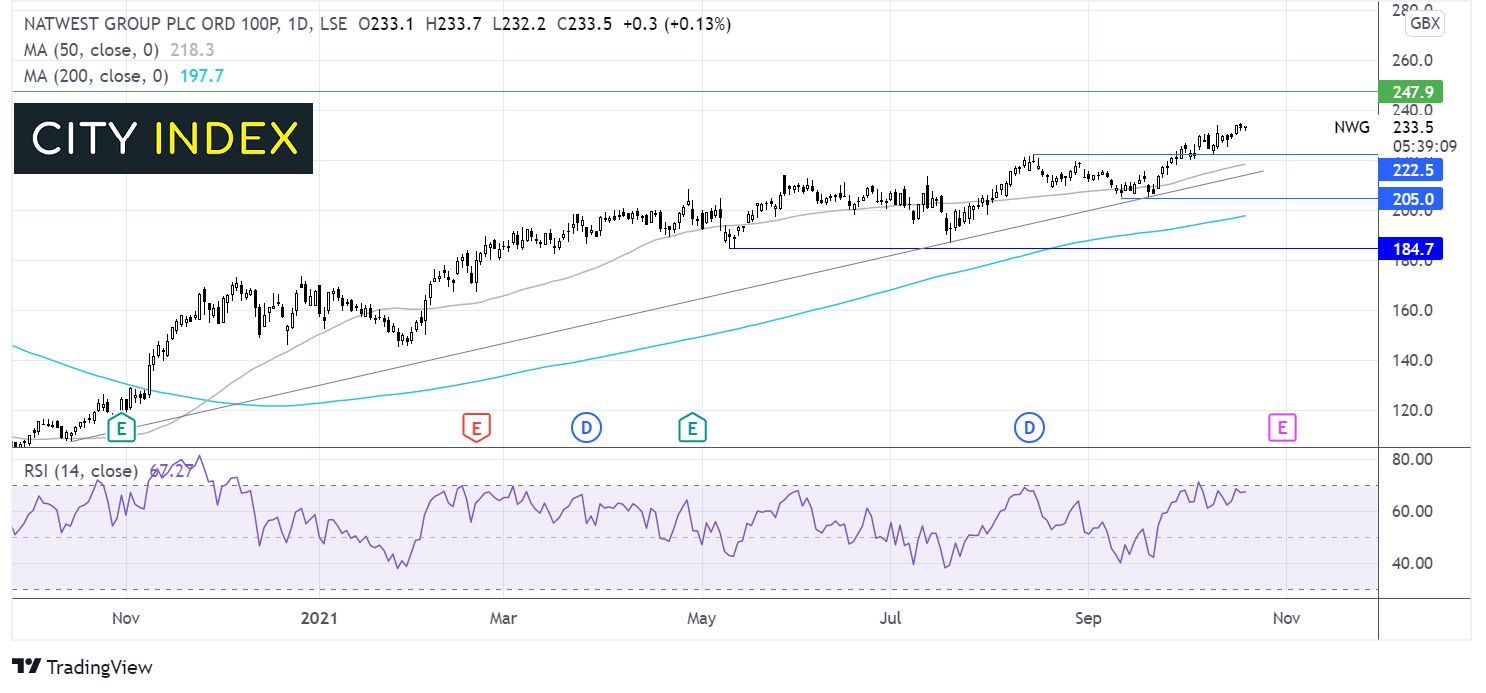
Where next for the NatWest share price?
The NatWest share price has been trending higher across the year. It trades above its 50 & 200 sma and above a rising trendline dating back to mid-October. The share price has recently broken out above its previous post pandemic high at 222p and the pre-pandemic 230p level. The RSI is keeping buyers optimistic whilst it remains out of overbought territory. Bulls are targeting 248p the December 2019 high. Meanwhile it would take a move below 204p the September low for the bears to gain traction.
How to trade with City Index
Follow these easy steps to start trading with City Index today:
- Open a City Index account, or log-in if you’re already a customer.
- Search for the market you want to trade in our award-winning platform.
- Choose your position and size, and your stop and limit levels
- Place the trade.
Latest market news
Today 01:15 PM
Today 11:30 AM
Today 08:18 AM
Latest Banks articles
October 23, 2023 09:25 AM
October 13, 2023 12:45 PM
October 6, 2023 02:28 PM
July 21, 2023 01:38 PM