


April 16, 2020 12:31 PM
Tying it All Together with Copper
Copper is often referred to as “Dr Copper”, as it is often viewed as a gauge of world economic health. The price of copper has turned higher recently, as it is often correlated with the stock prices and commodity currencies, such as AUD/USD. We have discussed recently how it appears the Australian Dollar may be running into resistance and how the Aussie is correlated with stock markets. The Australian Dollar is also correlated with copper. So, let’s look at the last leg of this 3-ring circus and bring it all together.
Firstly, although central banks around the world are still in QE+ mode, Australia’s Employment Change released today showed an overall increase of 5,900 jobs vs an expectation of -40,000 jobs. However, the US initial Claims Jobless Claims data showed that an additional 5,245,000 people filed for unemployment benefits last week. This brings the total to 22,000,000 initial claims over the last 4 weeks! In addition, the Philadelphia Fed Manufacturing Index was -56.6 vs -29 expected (its worst reading since 1980). Combine this data with an equally horrible New York Fed Manufacturing Index and Retail Sales from yesterday, and we see an awful picture emerging for the data for the rest of April for the US. Many other countries are showing poor data for April as well, and the nail in the coffin could be next week’s global PMI data.
Now, onto copper. The price of copper has been trending higher as of late, in parallel with the S&P 500 and AUD/USD. Price has stalled at horizontal resistance, the 61.8% retracement from the January 16th highs to the March 19th lows, and the 38.2% retracement from the March 4th highs to the March 19th lows. This resistance zone is between 2.32 and 2.37. The correlation coefficient for Copper vs the AUD/USD is +.86 and vs the S&P 500 is +.91.
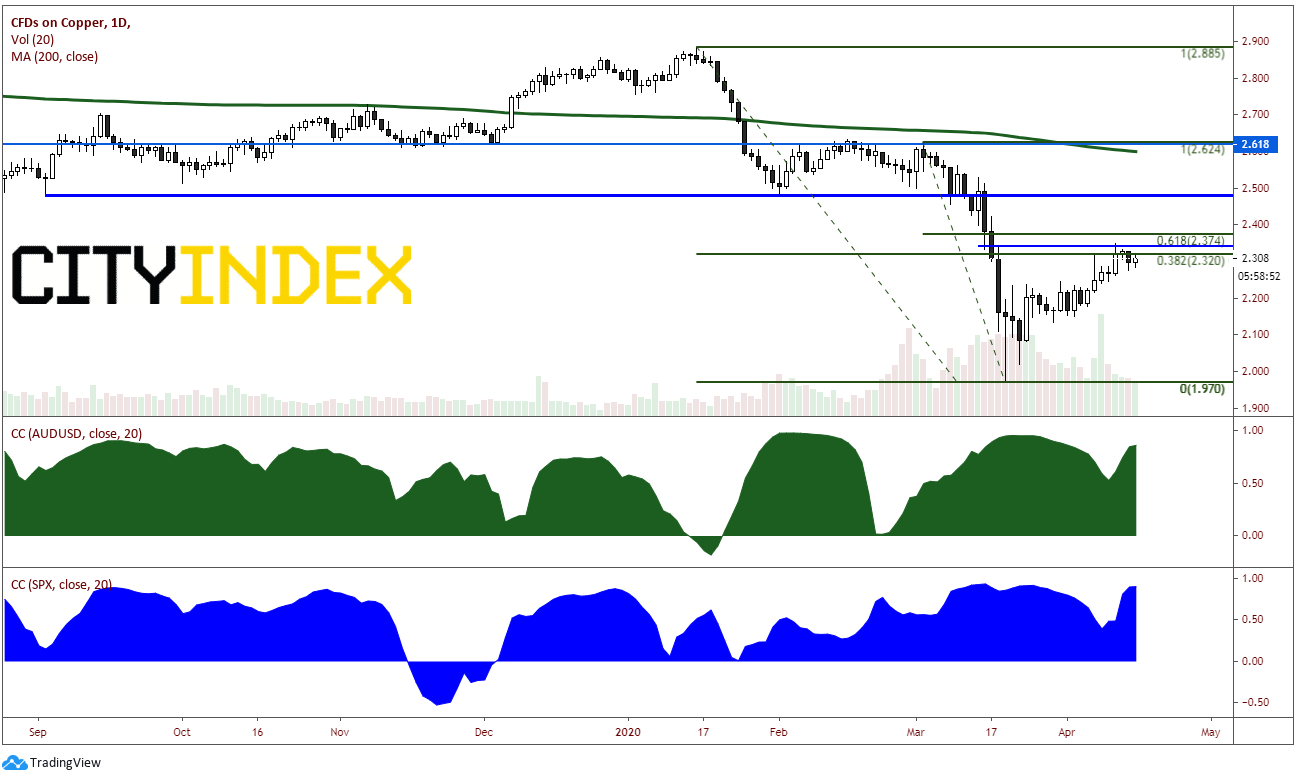
Source: Tradingview, City Index
On a 240-minute timeframe, copper has formed a rising wedge and the RSI is currently diverging from price. (If price were to put in a new high while the RSI puts in a lower high, than this would be considered a 3-drive formation, which is a high probability indication of a possible reversal). The target for a breakdown of a rising wedge is a 100% retracement of the wedge, which is near 2.00!
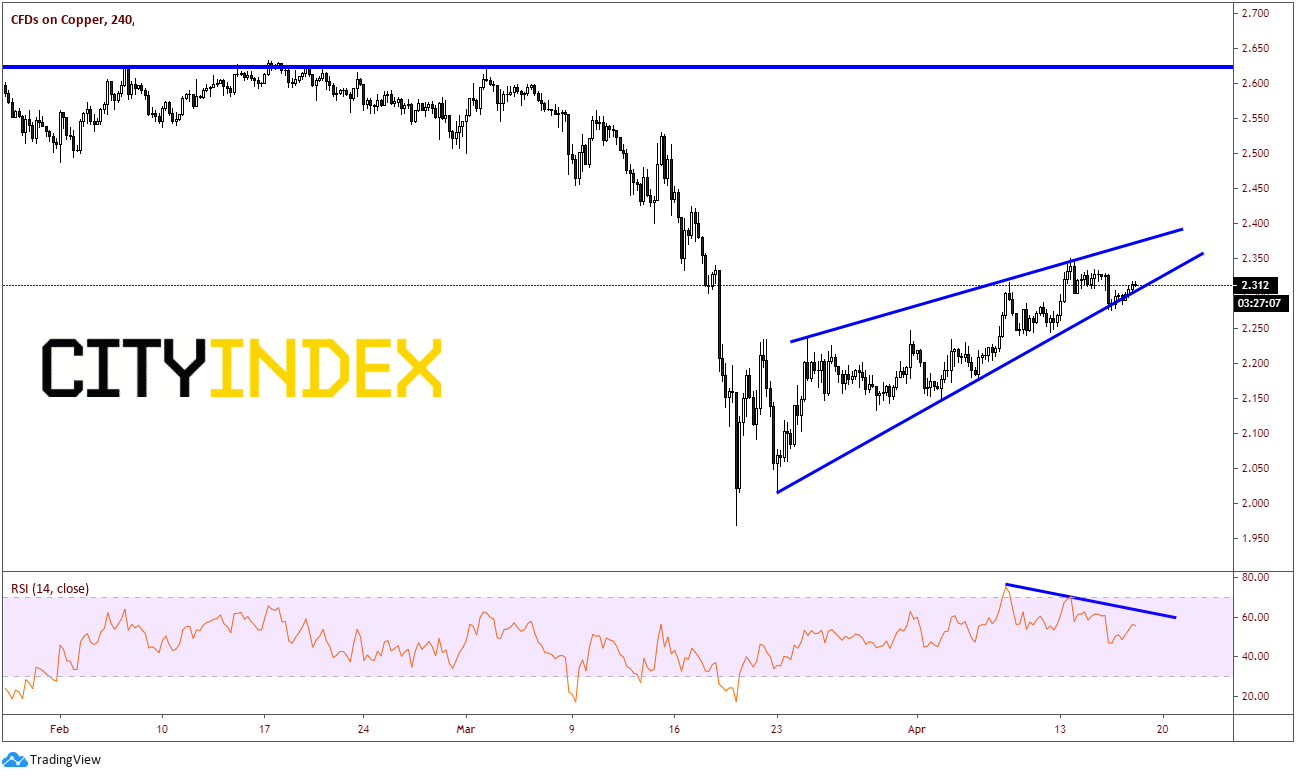
Source: Tradingview, City Index
Is the worst of the coronavirus behind the world economy? According to copper, the S&P 500, and AUD/USD, one may think so, as all have gone bid over the last few weeks and data is considered a lagging indicator (poor data in this case). However, if this resistance holds in copper, and the 3 asset classes turn lower together, than the markets would be telling us that we are not out of the woods!
Latest market news
Today 11:14 AM
Today 08:28 AM
Yesterday 03:30 PM
Latest Indices articles

Yesterday 03:30 PM
April 18, 2024 04:46 PM