

Oil retakes $80, inventory data in focus
After a brief pause in the run higher yesterday, oil prices are pushing northwards thanks to a bigger than expected draw in API US crude stockpiles.
The API institute saw crude stock piles rise by 5.2 million barrels but gasoline inventories fell by 4.6 million barrels. Expectations had been for crude stockpiles to rise 0.7 million barrels and gasoline stockpiles to drop by 0.1 million barrels. EIA data is due later.
Prices are also being supported by comments from the EIA that crude oil production in the US will decline in 2021 by more than expected.
The supply side of the market remains tight after OPEC decided to stick to its output plan agreed in July, hiking output by just 400k bpd. Yesterday OPEC trimmed its oil demand forecast for 2021, although they noted that surging natural gas could boost oil demand as end users switch.
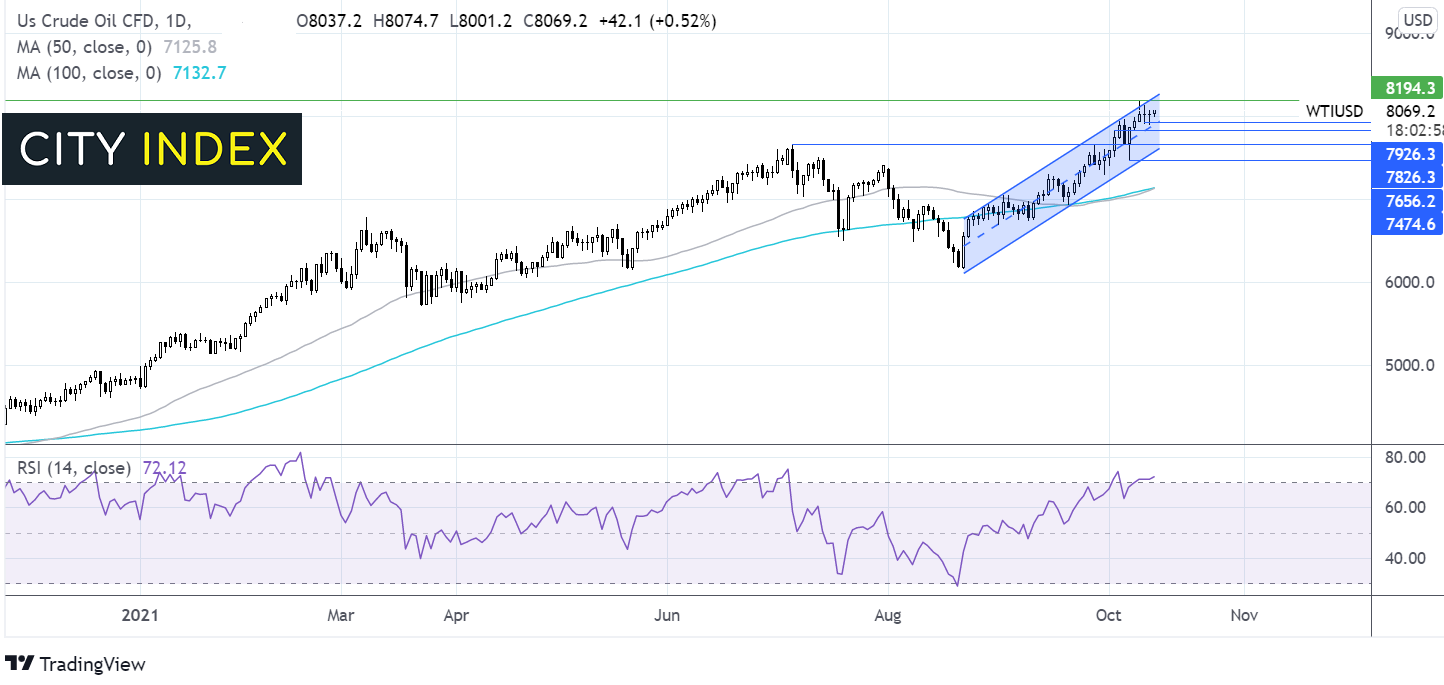
Where next for WTI oil?
WTI trades back over $80 and remains firmly within the ascending channel. The RSI has toppled into overbought territory so there could be some consolidation or a move lower on the cards.
On the upside immediate resistance can be seen at 81.94 the recent seven year high touched earlier in the week.
On the downside watch for a move below 79.10 the weekly low to negate the near term uptrend.
S&P 500 tests 100 sma with banks earnings in focus
US indices closed mixed on Wednesday following higher than forecast CPI data and FOMC minutes which indicated that the Fed will announce the taper of bond purchases mid November to mid December.
Looking ahead earnings are due from the banks including Wells Fargo, Morgan Stanley, Citigroup and could drive sentiment.
Initial jobless claims will also be in focus with expectations of a decline to 319k, from 326k.
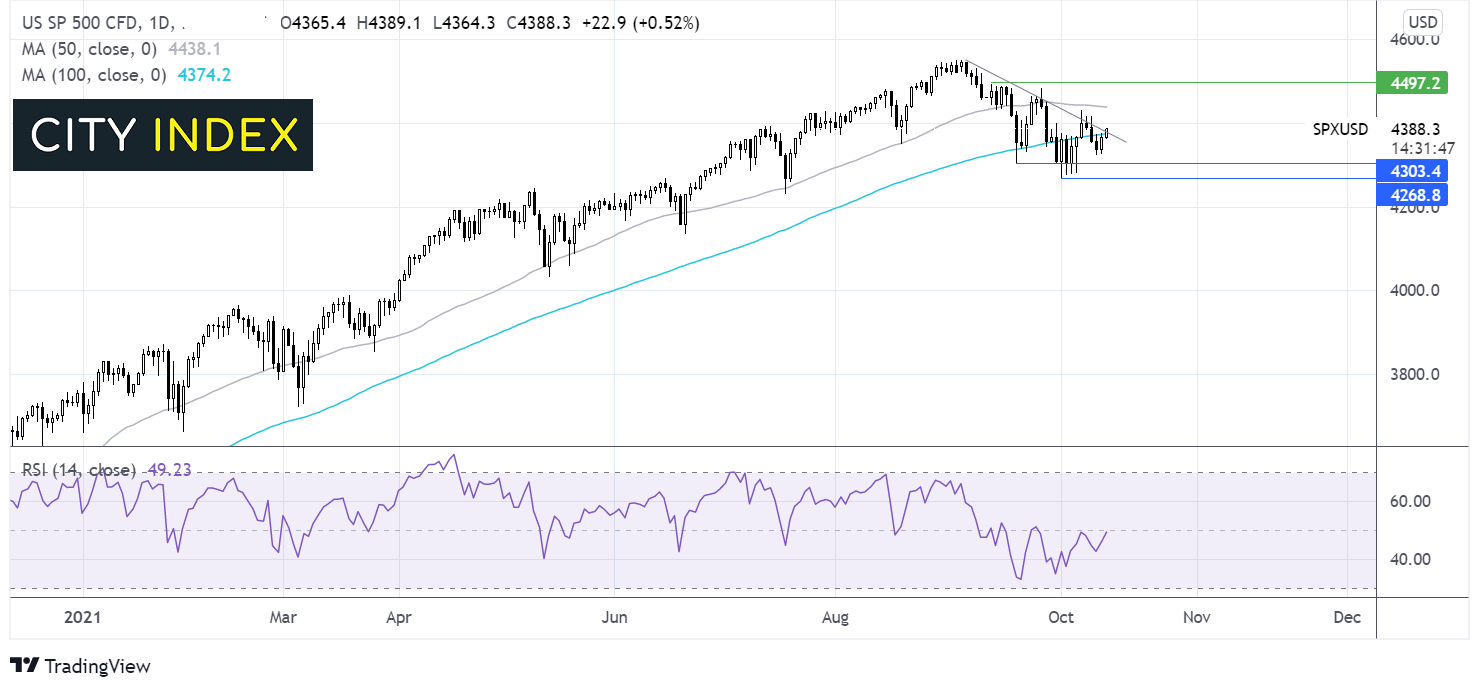
S&P 500 trading guideWhere next for the S&P 500?
The S&P 500 has been trending lower since early September hitting a nadir of 4270 at the start of the month. The S&P is extending its rebound from 4270, the 2.5 month low and is attempting to retake the 100 sma and falling trendline resistance at 4375.
A move over this level exposes the 50 sma at 4440, above here buyers could gain traction to wards 4500 the round number and mid-September high.
Failure to retake the 100 sma & falling trendline could see the price target 4300 the September 17 low ahead of 4270 low.
How to trade with City Index
Follow these easy steps to start trading with City Index today:
- Open a City Index account, or log-in if you’re already a customer.
- Search for the market you want to trade in our award-winning platform.
- Choose your position and size, and your stop and limit levels
- Place the trade.
Latest market news
April 25, 2024 03:09 PM
April 25, 2024 03:00 PM
April 25, 2024 01:12 PM
April 25, 2024 11:14 AM
Latest Indices articles

April 25, 2024 03:09 PM

April 25, 2024 03:00 PM
April 24, 2024 03:30 PM

April 18, 2024 04:46 PM