


WTI consolidates ahead of inventory data
Global growth optimism amid the reopening of the West is boosting the demand outlook.
The softer tone surrounding the US Dollar which trades at a 4.5 month low also under pins oil
Indirect Iran – US talks to revive the 2015 nuclear deal begin again this week.
Bloomberg reports the WTI time spread (the June – July spread) is at the strongest level since May 2020.
This spread serves as an indicator of the supply demand balance at main US storage hubs. Strength indicates inventories are tight as oil refineries ramp up output.
EIA inventory data is due.
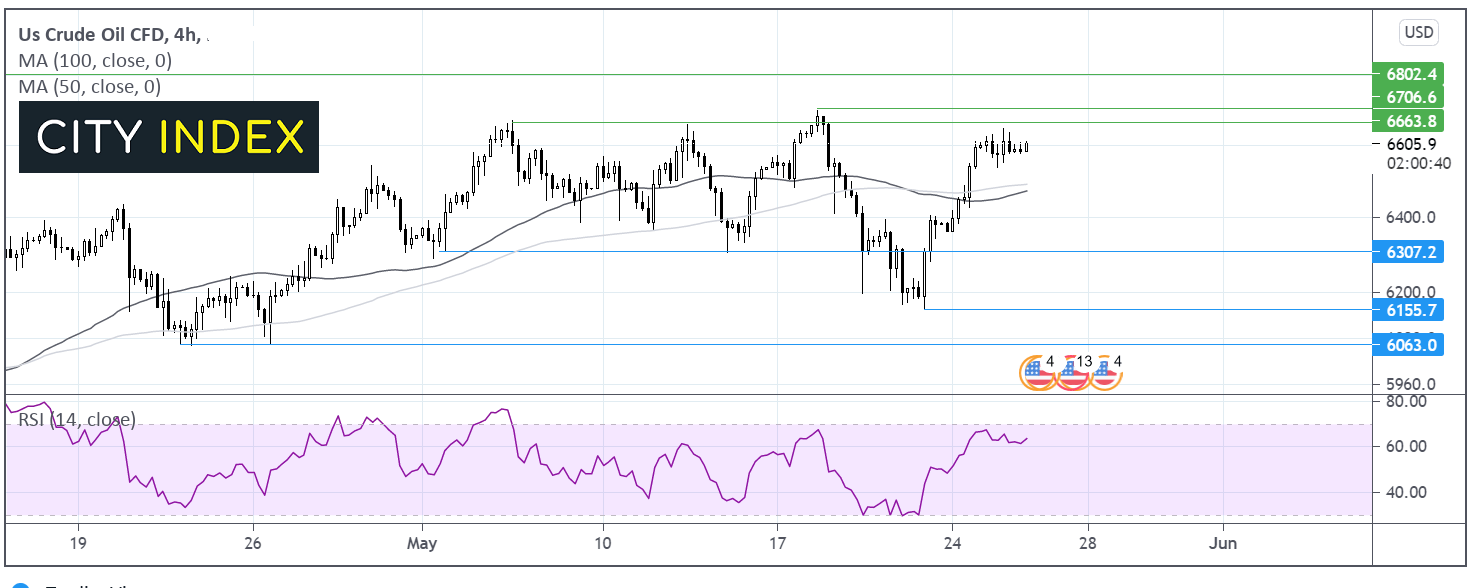
Where next for WTI crude oil prices?
WTI is consolidating around $66 after booking gains of 4% so far this week.
Whilst it trades above its 50 & 100 sma on the 4 hour chart and the RSI is bullish, buyers remain optimistic of a move towards 66.60 and 67.00 May 18 high.
On the downside, support cane be seen at 64.75 the 50 & 100 sma. A break below here could negate the recent uptrend and see the sellers gain traction towards 63.00 low May 3rd & 13th.
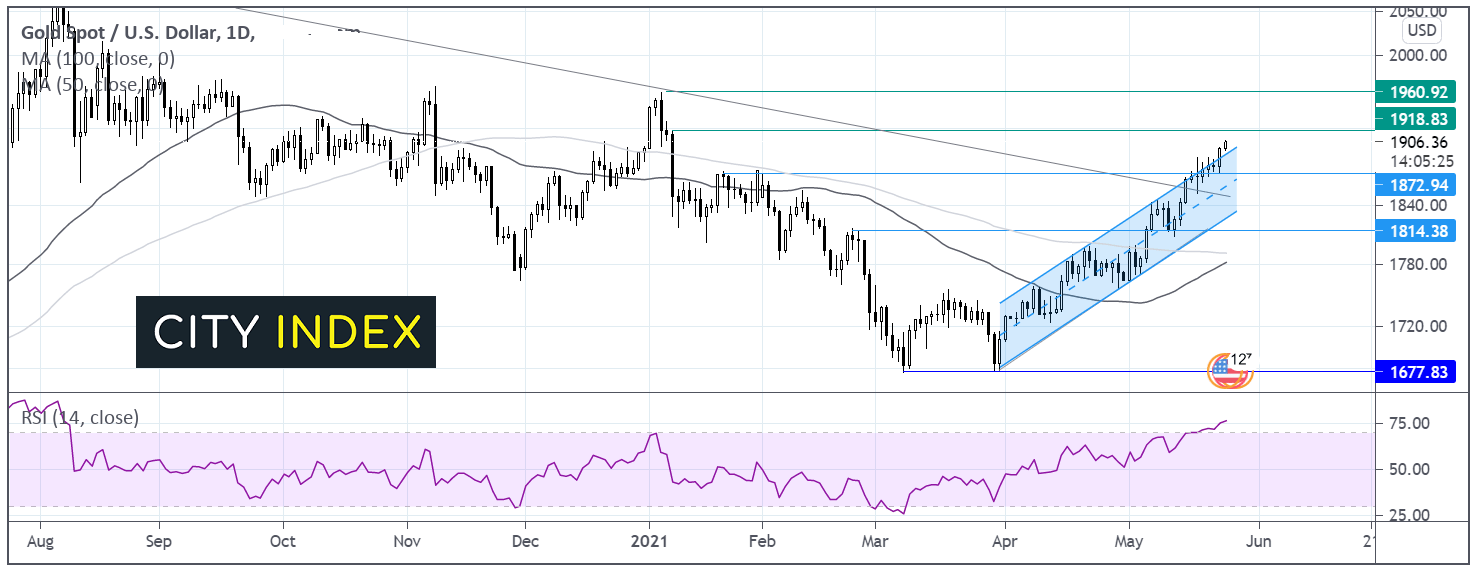
Gold breaks above 1900, Fed speak in focus
Gold trades at multi month highs after outperforming on Tuesday.
Weaker US treasury yields and the US Dollar trading at 4.5 month low helped Gold push above resistance at 1890.
Fed speaker continue to dismiss inflation concerns indicating a supportive monetary policy for longer.
The upbeat market mood could cap gains.
The economic calendar is quiet today meaning that Fed speakers will be closely watched.
Where next for Gold?
Gold has broken above the descending trendline dating back to August. Gold has broken out above the ascending channel dating back to early April.
The RSI is in overbought conditions which could mean that there is some consolidation before the next leg higher towards 1917 the high January 8, ahead of 1960 high January 7 as bulls moving towards the elusive 2000 level.
It would take a move below 1870 to negate the current near term uptrend.
How to trade with City Index
Follow these easy steps to start trading with City Index today:
- Open a City Index account, or log-in if you’re already a customer.
- Search for the market you want to trade in our award-winning platform.
- Choose your position and size, and your stop and limit levels.
- Place the trade.
Latest market news
Today 08:18 AM
Yesterday 10:40 PM
Latest Crude Oil articles
Yesterday 04:00 PM
April 19, 2024 03:35 AM
April 17, 2024 05:00 PM
April 17, 2024 03:02 AM