USDCAD rises above 1.25 as oil tumbles, US inflation due
USDCAD is rising, snapping a two-day decline and rebounding from the 2022 low.
The loonie is tracing oil prices lower after the US mulls over a massive release of strategic oil reserves to ease surging prices and bring down soaring inflation.
Remarks from Biden are expected later, after the OPEC+ announcement. OPEC+ is not likely to raise the current production output increase in May from 400,000 bpd.
Looking ahead, Canadian GDP data is expected to show growth of 0.2% MoM in January, up from 0% in December. The annual budget is also set to be released.
The US Dollar is holding steady after two days of decline. Attention is turning toward US core PCE inflation data, which is expected to rise 5.5% YoY in February, up from 5.2% in January. Hot inflation could fuel hawkish Fed expectations a lift the USD.
Learn more about trading CADWhere next for USD/CAD?
USD/CAD has traded relatively range-bound over the past week, capped on the upside by 1.2560 and the lower side by 1.2460.
A brief spike lower has seen USDCAD extend its recovery from 1.2430, the 2022 low, and is seen pausing at 1.25, the falling trendline resistance.
A break above here could see the pair head towards the 50 SMA on the four-hour chart at 1.2530. A break above this level could see 1.2560 come into focus and the 1.26 round number. A move above here would create a higher high and could see the bulls gain momentum.
On the flip side, 1.2460, the March 25 low appears to offer support ahead of 1.2430- the year today low; a break below here would create a lower low.
FTSE edges higher after Q4 GDP upwardly revised
The FTSE, along with its European peers, is set to rise on the open after UK GDP was upwardly revised in the final three months of 2021.
UK GDP recorded growth of 1.3% QoQ, up from 1%, boosted by a jump in activity in the health sector amid the onset of Omicron. This was up from 0.9% QoQ growth in Q3 but down from 5.6% in Q2.
Despite the upbeat growth, the outlook is less encouraging, given the surge in inflation and rising interest rates.
Oil majors could drag on the index as oil prices tumble, and resource stocks could also come under pressure after Chinese PMI data showed a contraction in both services & manufacturing.
Learn more about the FTSEWhere next for the FTSE?
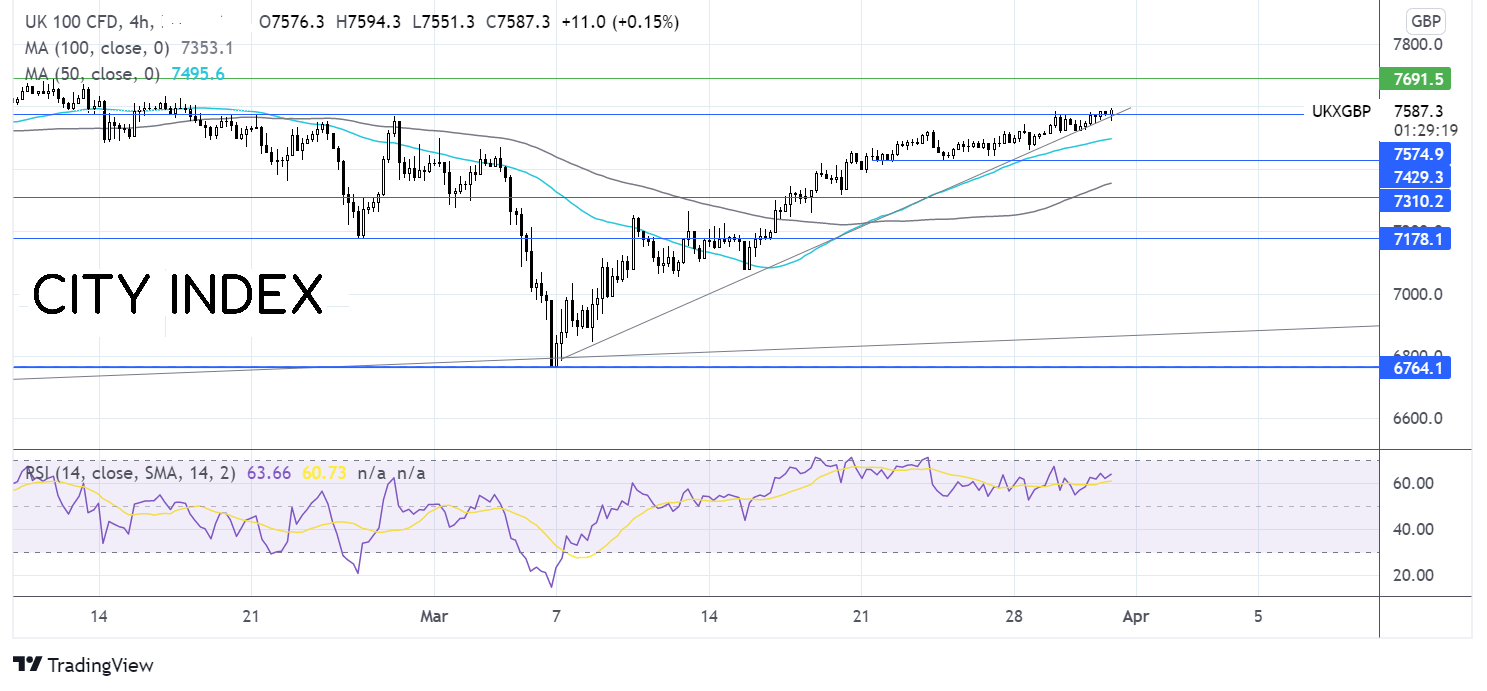
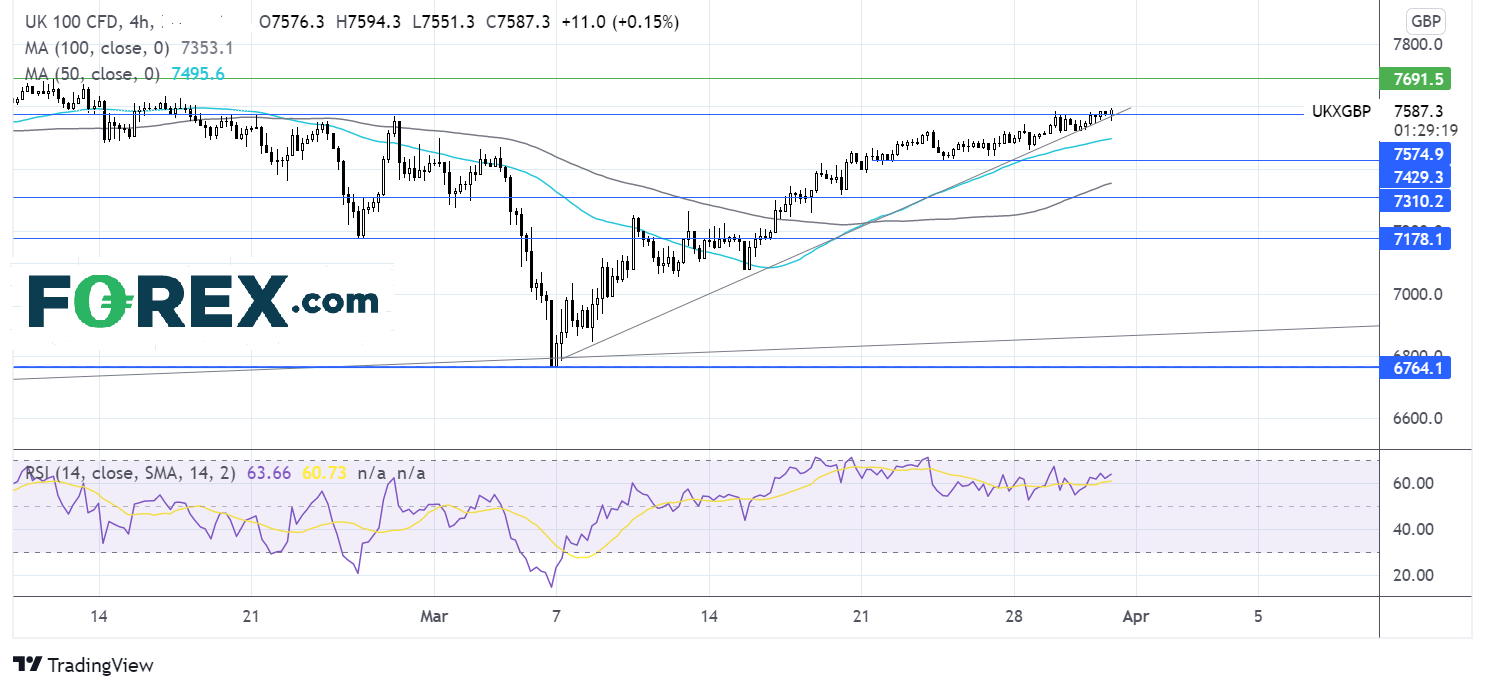
The FTSE has extended its rebound from the 2022 low of 6750. It trades above its rising trend line dating back to the start of the month and is testing resistance around 7580, a level that has offered resistance on several occasions across the past six months. The RSI supports further upside while it remains out of the overbought territory. A break higher could bring 7690 the post pandemic high into focus.
Should the rally higher lose momentum, support can be seen at 7500, the 50 SMA on the 4-hour chart. A break below here exposes 7435, a level that has offered support on several occasions across the past ten days.


How to trade with City Index
Follow these easy steps to start trading with City Index today:
- Open a City Index account, or log-in if you’re already a customer.
- Search for the market you want to trade in our award-winning platform.
- Choose your position and size, and your stop and limit levels
- Place the trade.


