


Gold ahead of Core PCE Inflation data
Annual PCE price index, the Fed’s preferred gauge of inflation is expected to rise to 2.9% in April up from 1.8% in March.
The data comes as inflation concerns have stalked the market particularly since the Consumer Price Index inflation data jumped to 4.2% in April from 2.6% in March. Following the data the US Dollar jumped 0.7%.
A strong PCE print could fuel concerns that the Fed will look to move early on interest rates, boost treasury yields.
Gold is a hedge against inflation but is non yielding so is extremely sensitive to treasury bond yields.
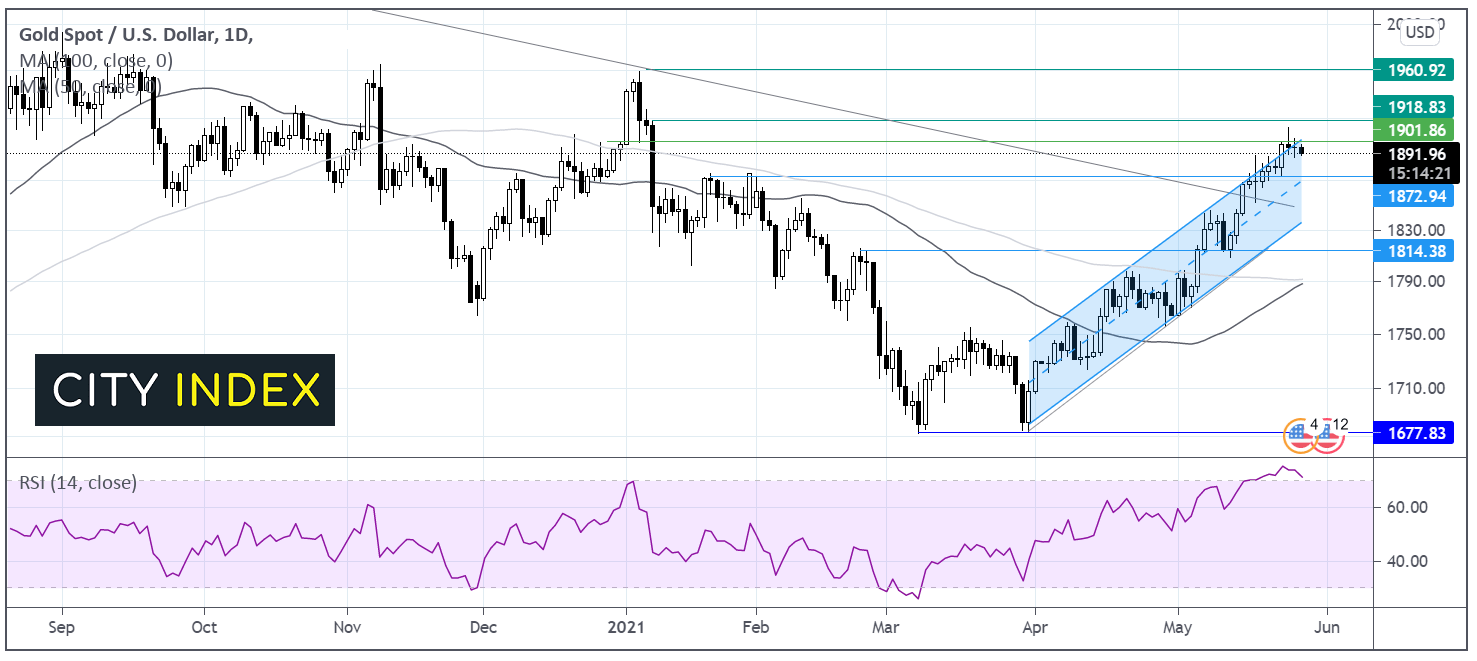
Where next for Gold prices?
Gold broke out above its ascending channel hitting a fresh 4 month high of $1912 on Wednesday. The price has just eased back slightly back under $1900 and back into the ascending channel.
The RSI shows is in overbought territory suggesting that that any decline resulting from a strong Core PCE reading is likely to be more severe than the upside stemming from a weaker inflation print.
Given that gold is up over 7% so far this month, it could in fact be seen as an opportunity to book profits.
Resistance is seen at $1900 round number ahead of $1912 the weekly high.
A move below $1870 horizontal support could negate the current near term uptrend.
Learn more about trading gold
WTI support by US data, Baker Hughes rig count in focus
Oil prices are pushing higher following from strong US data in the previous session as jobless claims hit a 14 month low.
Expectations of a strong economic recovery are lifting demand expectations for Q3.
There is a growing belief that if the 2015 Iran nuclear deal is revived sanction won’t be lifted immediately and oil will only be returned to the market gradually.
OPEC+ are expected to stick to the plan of gradually raising output when the meet on Monday, underpinning the market mood.
Baker Hughes rig count due later today.
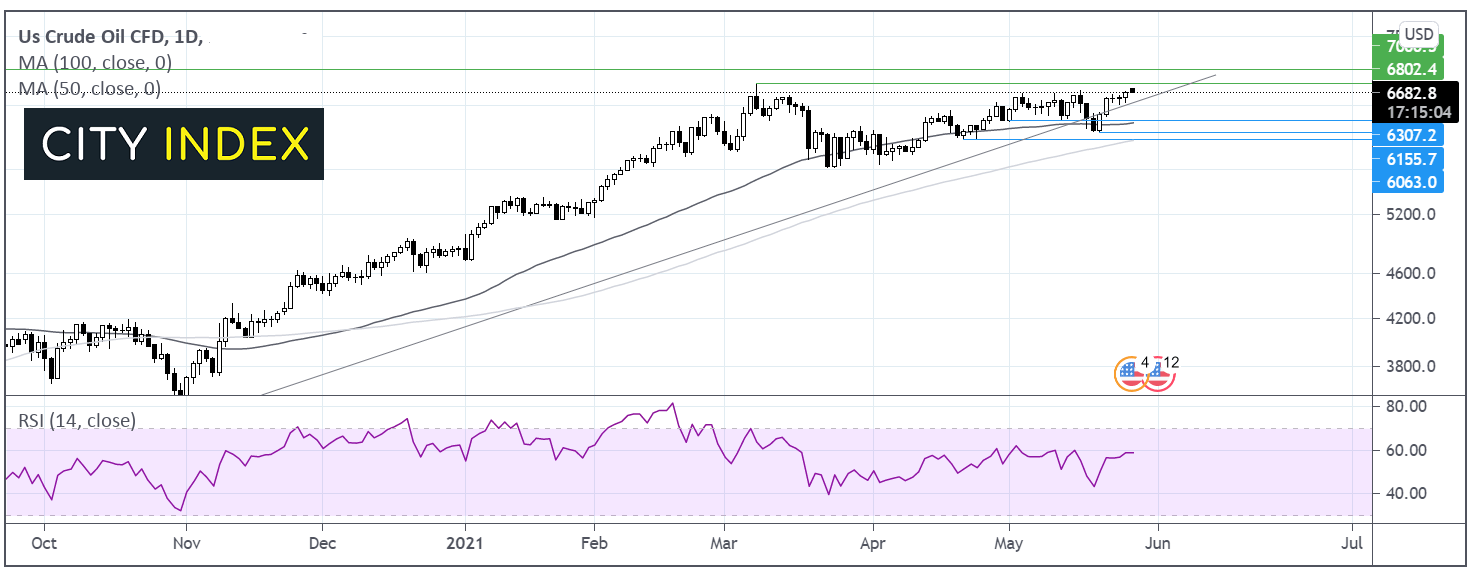
Where next for crude oil?
Oil trades above its ascending trendline dating back to mid March. It trades above its 50 & 100 sma on the daily chart showing an established bullish trend.
After hitting a high of 67.67 in March the price has failed to form a higher high above that level.
Bulls have been hovering around this level for 3 months. The RSI is supportive of further upside above the 50 level but out of overbought territory.
Bulls need to break above 67.67 in order to head towards $70 round number and psychological level.
It would take a move below 63.00 to negate the current uptrend.
How to trade with City Index
Follow these easy steps to start trading with City Index today:
- Open a City Index account, or log-in if you’re already a customer.
- Search for the market you want to trade in our award-winning platform.
- Choose your position and size, and your stop and limit levels.
- Place the trade.
Latest market news
Yesterday 08:33 AM
Latest Crude Oil articles
April 17, 2024 05:00 PM
April 17, 2024 03:02 AM
April 10, 2024 06:07 AM