
Gold looks vulnerable below $1700
Jerome Powell expressed little to no concern over the recent spike in bond yields.
The US Dollar surged following the Fed Chair’s appearance, dragging on gold.
With bond yields rising on high inflation expectations, non-yielding gold looks less attractive.
Attention will turn to US NFP to see whether they support rising inflation expectations.
What are non -farm payrolls?
Where next for gold?
Gold fell 0.8% in the previous session and is on track for 2% decline this week.
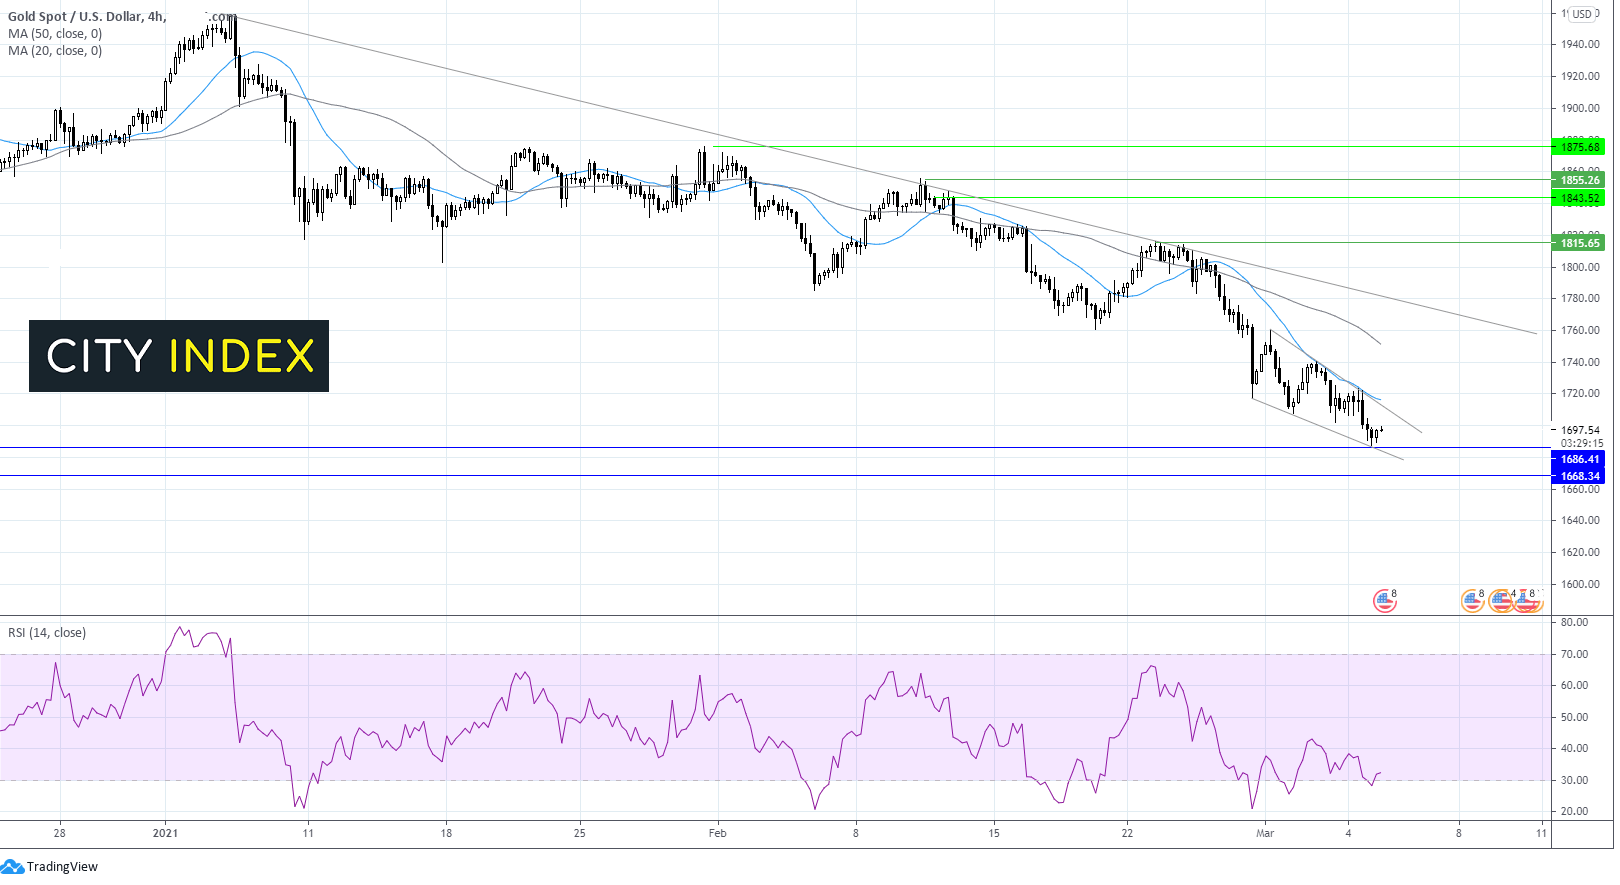
Gold hit an overnight multi-month low of $1687 as the price tested the lower band of a falling wedge on the 4 hour chart and horizontal support from June. The support has remained firm so far.
The RSI is hovering around oversold territory so some consolidation or a small bounce could be on the cards before further downside.
A close below the level could confirm a downside breakout with a deep decline towards 1670 June low on the cards.

On the upside any recovery could find resistance at $1700 round number. A break through this level could sees the price look to attack $1717 the confluence of the upper band of the falling wedge and the 20 sma.
Learn more about trading commodities

S&P 500 break below key support post Powell, NFP in focus
The S&P 500 sank 1.3% on Thursday after Fed Powell failed to calm bond market volatility fears, sending bond yields surging to 1.50%
Treasury yields hit 1.50% a one year high.
The spike in yields is negative for stocks as it points to higher borrowing costs which slows growth.
A strong NFP could prompt higher inflation expectations and drag the S&P 500 lower.
Where next for the S&P500?
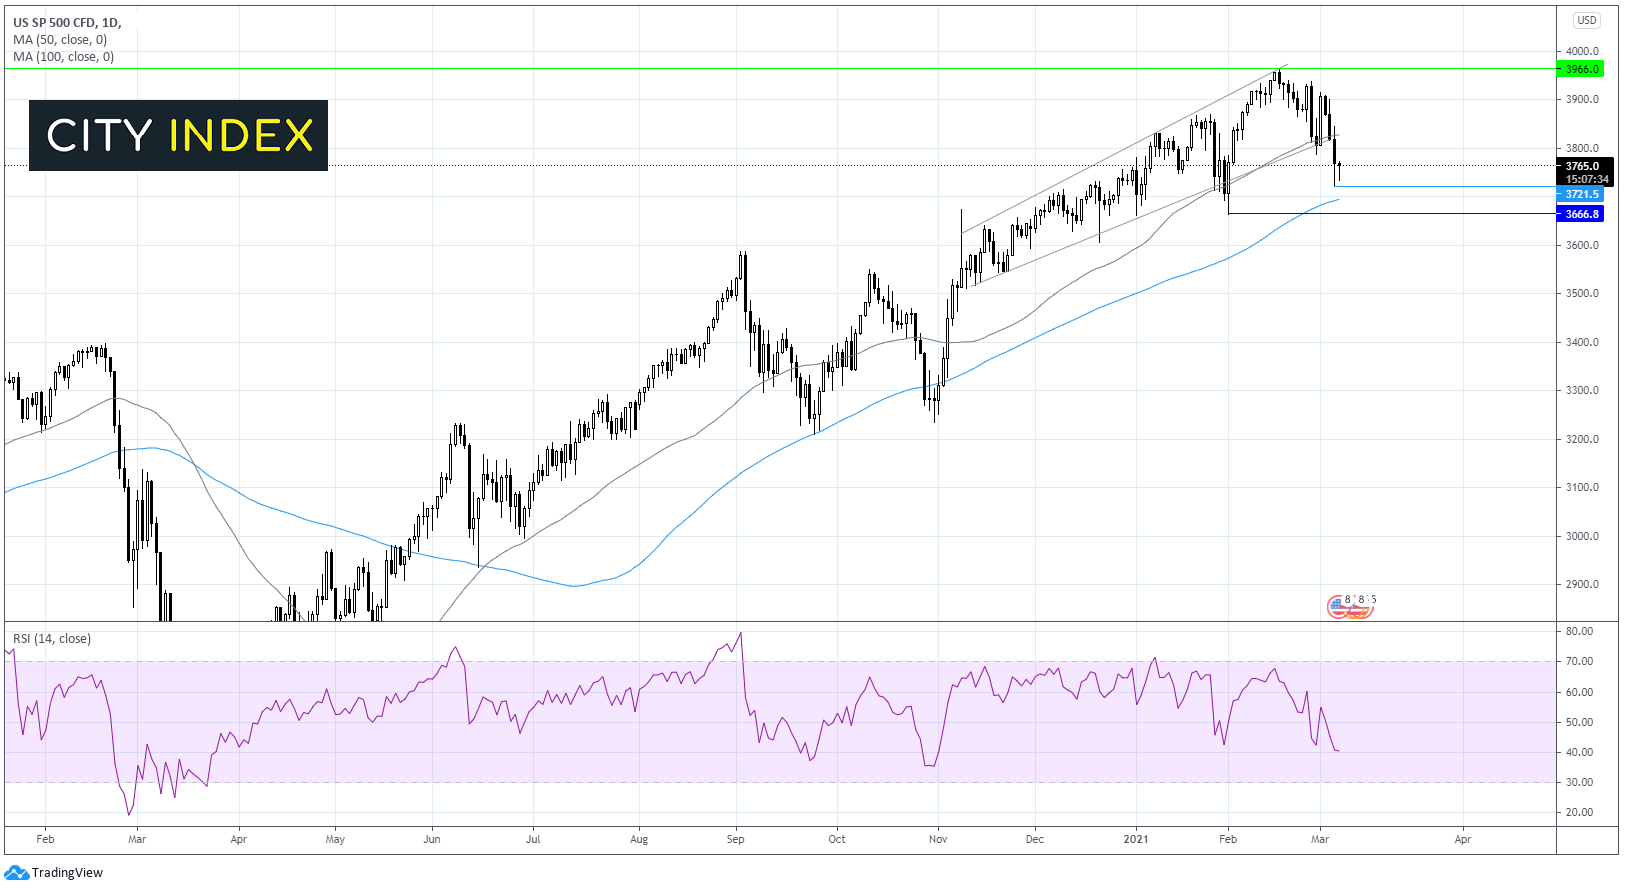
The S&P slumped on Thursday falling through the key level of 3820, the confluence of the 50 sma on the daily chart and the lower band of the ascending trend line dating back to early November.
The S&P found support at 3720 (low 27 Jan) and has since rebounded to 3764.
However, the outlook remains bearish with the RSI supportive of further losses.
Immediate support can be seen at 3720 yesterday’s low. A break bellow here could see the 100 sma and round number tested at 3700 ahead of the yearly low of 3640.
Any recovery will need to break above 3820 which looks to be a strong nut to crack.
Learn more about trading indices


