


Gold looks to 1780 on USD weakness
The US Dollar is easing lower following treasury yields southwards. Weaker than expected US industrial production data dampened hawkish Fed bets. Factory output fell -1.3% MoM, expectations had been for growth 0.2%.
Bets are also rising that other central banks will start normalizing monetary policy ahead of the Fed.
The weak greenback boosts the appeal of gold for holders of other currencies.
Fed speakers Daly, Bostic and Harker will be in focus in an otherwise quiet economic calendar.
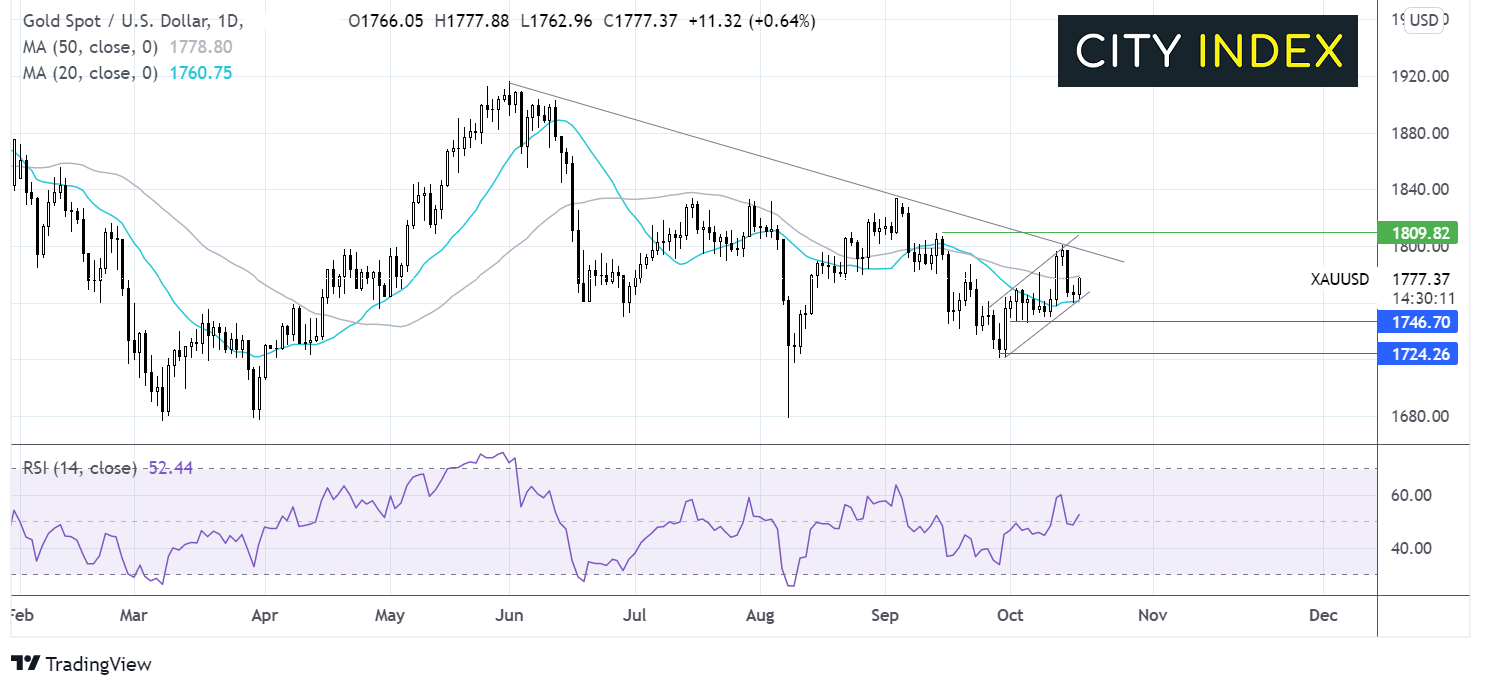
Where next for Gold prices?
Gold continues to extend gains from 1716 low reached on October 1. It trades within the two-week rising channel. It also trades caught between its 20 & 50 dma.
Whilst the RSI is supportive of further upside, buyers will look for a move above the 50 dma at 1778 to attack the multi month falling trendline resistance at 1800 and October 14 high. A move above here would cement the bullish bias.
Meanwhile bears could look for a move below the 20 sma and lower band of the rising channel at 1760 to cement a bearish bias.
Nasdaq in focus, Netflix to release earnings
Big tech outperformed in the previous session, including Apple following its hardware event.
Treasury yields falling and tempered expectations surrounding a more hawkish Fed helped drive a rotation back into tech.
Netflix is due to report earnings today as big tech earnings move into focus.
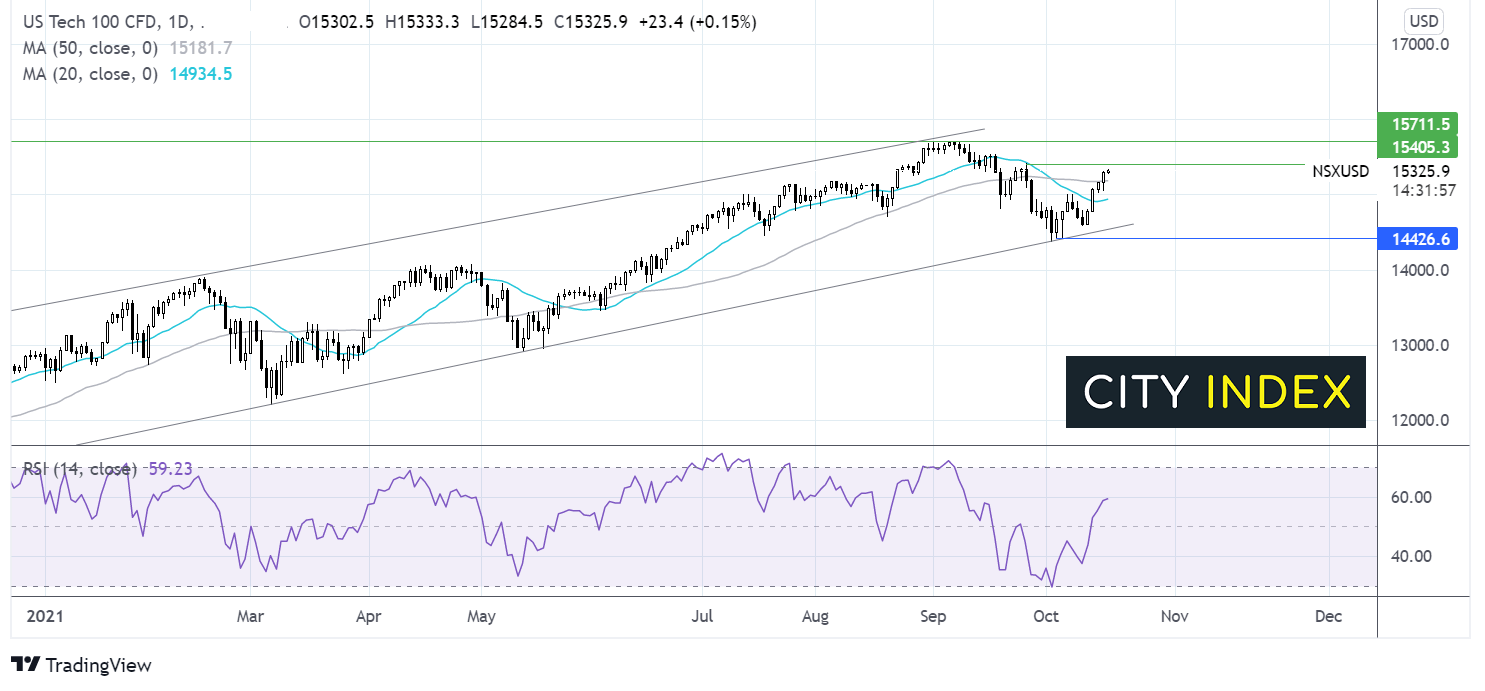
Where next for the Nasdaq?
The Nasdaq continues to trade in an ascending channel dating back to August last year. Earlier this month the price rebounded off the lower band of the rising channel.
The price has extended the push higher, retaking the 20 & 50 sma on the daily chart.
The RSI is keeping buyers optimistic of further upside. A move above 15425 the later September high could bring 15700 and fresh all-time highs back into play.
On the flip side support can be seen at 15200 the 50 sma and 14935 the 20 sma. A move below here could negate the near-term bullish trend. It would take a move below 14425 the October low for sellers to gain momentum.
How to trade with City Index
Follow these easy steps to start trading with City Index today:
- Open a City Index account, or log-in if you’re already a customer.
- Search for the market you want to trade in our award-winning platform.
- Choose your position and size, and your stop and limit levels
- Place the trade.
Latest market news
Yesterday 03:00 PM
Yesterday 01:12 PM
Yesterday 11:14 AM
Yesterday 08:28 AM
April 24, 2024 03:30 PM
Latest Indices articles

Yesterday 03:00 PM
April 24, 2024 03:30 PM
April 18, 2024 04:46 PM