

GBP/USD falls despite upbeat jobs data
GBP/USD is edging lower despite encouraging jobs data. UK unemployment ticked lower to 4.2% in the three months to October, down from 4.3%.
The claimant count dropped by an impressive 49.8k in November, after falling by 14.9k in October.
Wages including bonuses eased lower but ca\me in above expectations at 4.9%
The data suggests that the labour market is holding up well following the winding down of the furlough scheme, which is what the BoE wanted to see. However, with Omicron cases on the rise, the data BoE is unlikely to hike rates this month, regardless of the jobs data.
Omicron concerns are keeping the mood towards the pound depressed after the UK recorded its first Omicron death.
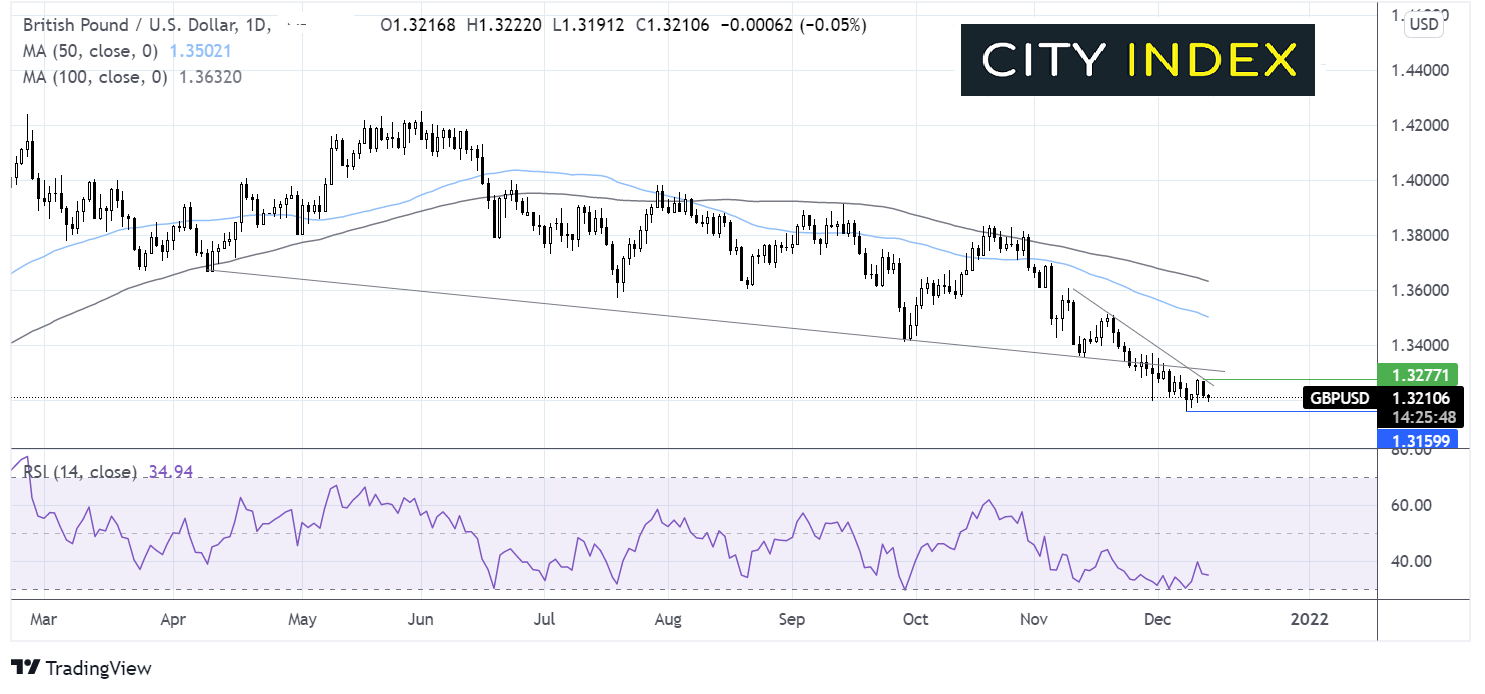
Where next for GBP/USD?
GBP/USD broke the below a falling trendline support at the start of December, before finding support at 1.3161 the yearly low. The recovery the 2021 low faced rejection at the 5-week falling resistance.
Currently the price remains below the falling trendline resistance but above support at 1.3160. The RSI is supportive of further losses whilst it remains out of oversold territory.
A breakthrough 1.3160 could bring 1.31 round number into focus.
Meanwhile buyers could look for a move over 1.3270 yesterday’s high and falling trendline resistance to open the door to 1.33 round number and trendline resistance.
Crude oil struggles on Omicron concerns, API data due
Oil is struggling to stay in positive territory after booking losses in the previous session. Concerns over Omicron, tighter COVID restrictions.
China identified its first case of Omicron and authorities swiftly implemented lockdown restrictions. A surge in COVID cases in China, the world’s largest importer of oil could hurt the demand outlook for oil.
Beyond COVID news attention will now turn to the API and EIA inventory data. API crude oil stockpile data is due later today. Last week API inventories fell by -3.089M. Another decline could offer some support to oil prices. A build in stockpiles could pull jittery oil markets lower.
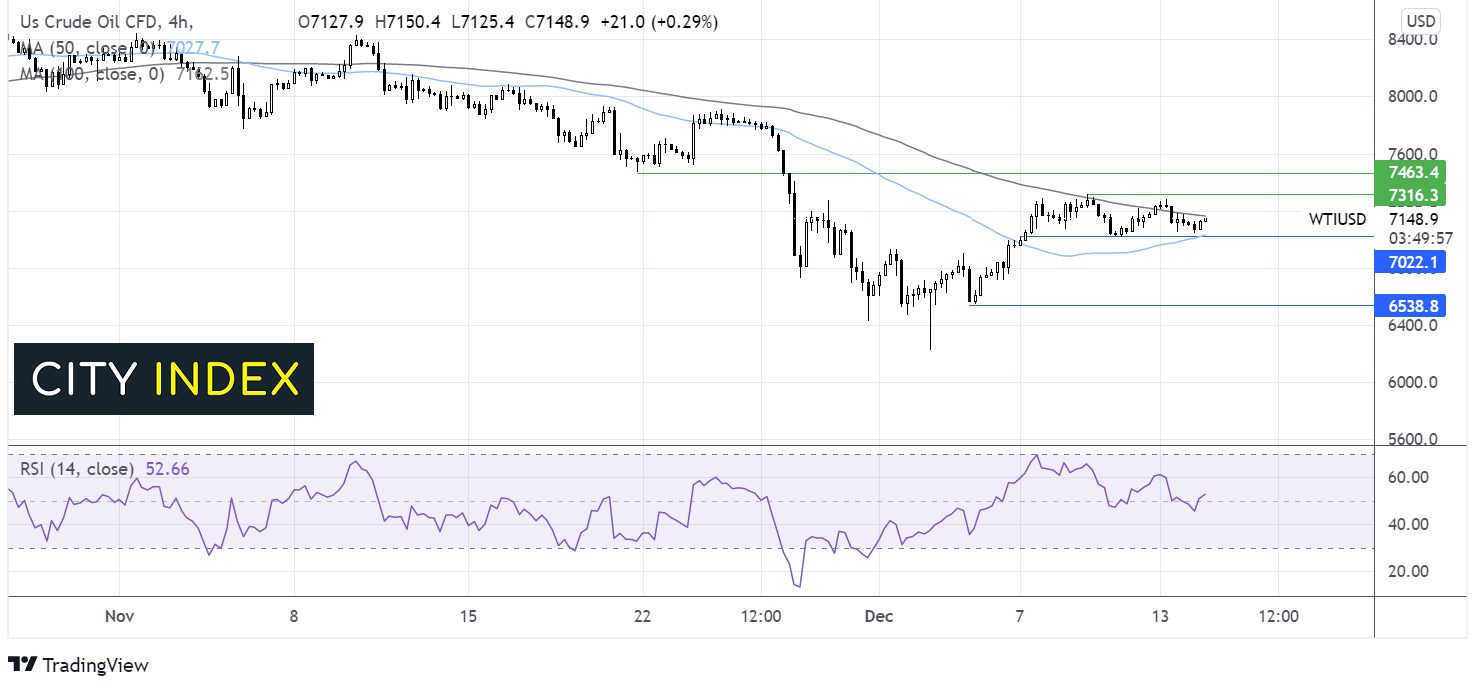
Where next for crude oil?
WTI oil’s rebound from 62.26 has stalled around the 100 sma on the 4-hour chart. The price is so far being supported by the weekly low and 50 sma around 70.20. The RSI is attempting to point higher but is broadly neutral.
Buyers will look for a move over the 100 sma at 71.70 and the December high of 73.70 in order to charge higher towards 74.50 the November 21 low.
Sellers will look for a move below 70.20 the weekly low and 50 sma. A break through here opens the door to support at 69.20 the swing high December 3 and 65.40 the December 3 low.
How to trade with City Index
Follow these easy steps to start trading with City Index today:
- Open a City Index account, or log-in if you’re already a customer.
- Search for the market you want to trade in our award-winning platform.
- Choose your position and size, and your stop and limit levels
- Place the trade.
Latest market news
April 25, 2024 03:09 PM
April 25, 2024 03:00 PM
April 25, 2024 01:12 PM
April 25, 2024 11:14 AM
Latest Trade Ideas articles


April 25, 2024 03:00 PM

April 25, 2024 11:14 AM
April 24, 2024 11:00 AM