


FTSE looks to PMI data
The FTSE along with European stocks are treading water, despite a stronger finish on Wall Street. Federal Reserve Chair Jerome Powell reassured the markets over inflation and monetary policy, calming market nerves.
Markets are starting to stabilize after the Fed’s hawkish turn last week. Meanwhile tensions between US and China rose after a US sailed through the Taiwanese straight.
PMI data will be in focus. UK PMI data is expected to show that the manufacturing sector continued expanding at an impressive pace in June at 64, although just down slightly from 65.9 in May. The services sector PMI is forecast at 62.8, marginally down from 62.9 in May.
Where next for the FTSE?
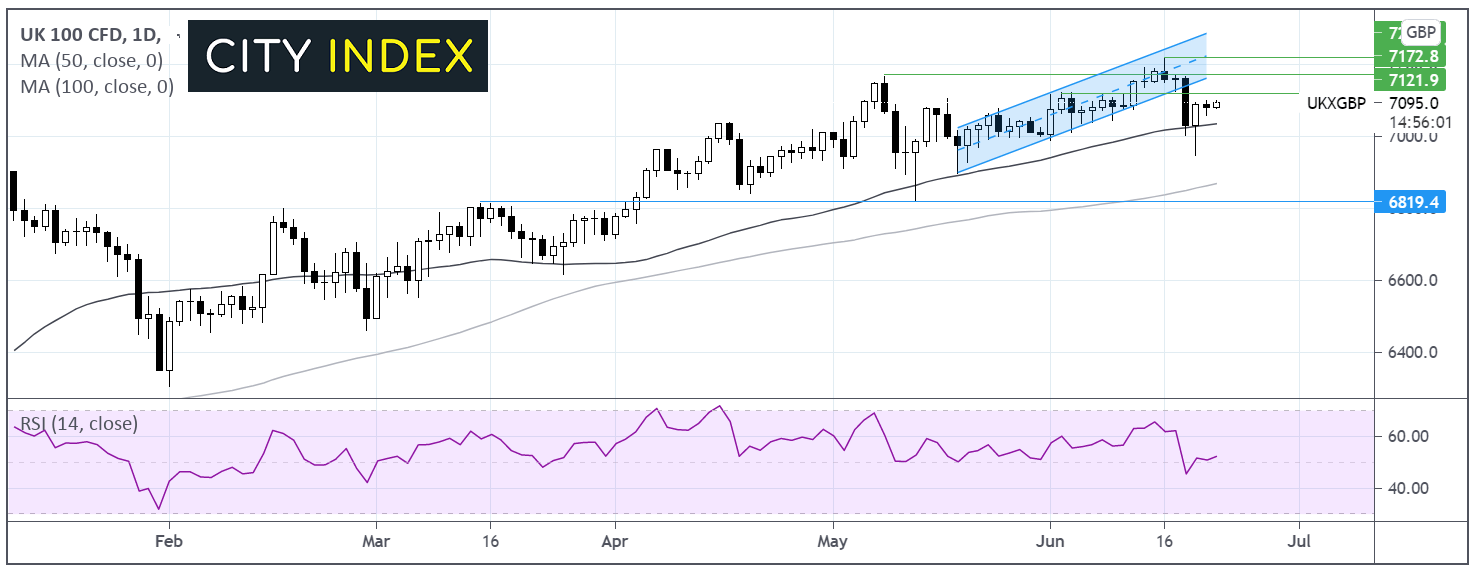
The FTSE broke below its ascending channel at the end of last week. The index spiked to a low of 6950 below pushing back over 7000 key psychological level and finding support on its 50 sma at 7030.
The index continues to extend the rebound today with the RSI supportive of further upside. Buyers could look towards resistance at 7120 high June 2 ahead of 7170, the confluence of the lower band of the ascending channel and June 10 high.
The 50 sma could offer support at 7030. A break below this level could negate the near term up trend. It would take a move below 6950 for the bears to gain traction.
Brent hits $75.00
Oil is pushing higher as rising fuel demand drained inventories.
API data revealed 7.1-million-barrel draw, well ahead of the 3.6 million forecast, this comes following an 8.5 million draw last week.
Fuel demand has been boosted by key markets such as US, China and Europe reopening their economies.
EIA inventory data is due later today.
OPEC+ will meet to discuss output next week and could look to raise production.
Where next for Brent?
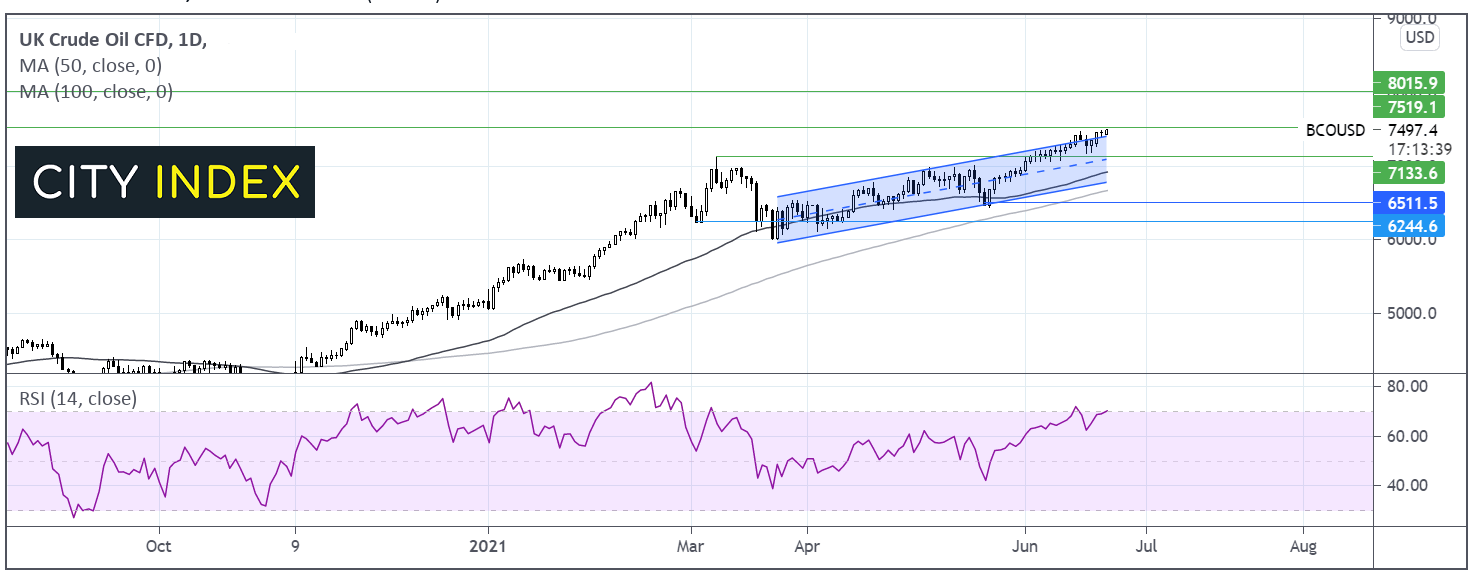
Brent trades at multi-year highs and hits $75.00. It is attempting to break out above its ascending channel within which it has traded since late March.
The RSI is heading into overbought territory which warrants caution for further bullish bets. A period of consolidation or a pull back could be on the cards.
A meaningful move over $75 could see fresh multi year highs achieved, with buyers looking towards $80 round number and psychological level.
It would take a move below $71.50 to negate the near-term uptrend. A move below 65.00 could see sellers gain traction.
How to trade with City Index
Follow these easy steps to start trading with City Index today:
- Open a City Index account, or log-in if you’re already a customer.
- Search for the market you want to trade in our award-winning platform.
- Choose your position and size, and your stop and limit levels
- Place the trade.
Latest market news
Yesterday 11:09 PM
Yesterday 11:01 PM
Yesterday 04:00 PM
Yesterday 01:15 PM
Yesterday 11:30 AM
Latest Brent articles
February 21, 2024 03:30 PM
November 28, 2023 09:05 PM
November 20, 2023 08:26 PM
November 8, 2023 06:11 PM