


EUR/USD rises ahead of Powell & Lagarde
EURUSD is edging higher paring losses from the previous session. Cautious trade dominates ahead of a testimony by Fed Chair Powell before Congress and a speech by ECB President Christine Lagarde.
Powell is expected to stick with the Fed’s hawkish bias as inflation is set to reach 7%. Congress is likely to grill Powell on the Fed’s plan to avoid high inflation becoming entrenched.
Separately ECB President Christine Lagarde is due to speak. The ECB is significantly more dovish than the Fed. The two speeches could highlight central bank diversion, hurting demand for the euro.
Learn more about the FedWhere next for EUR/USD?
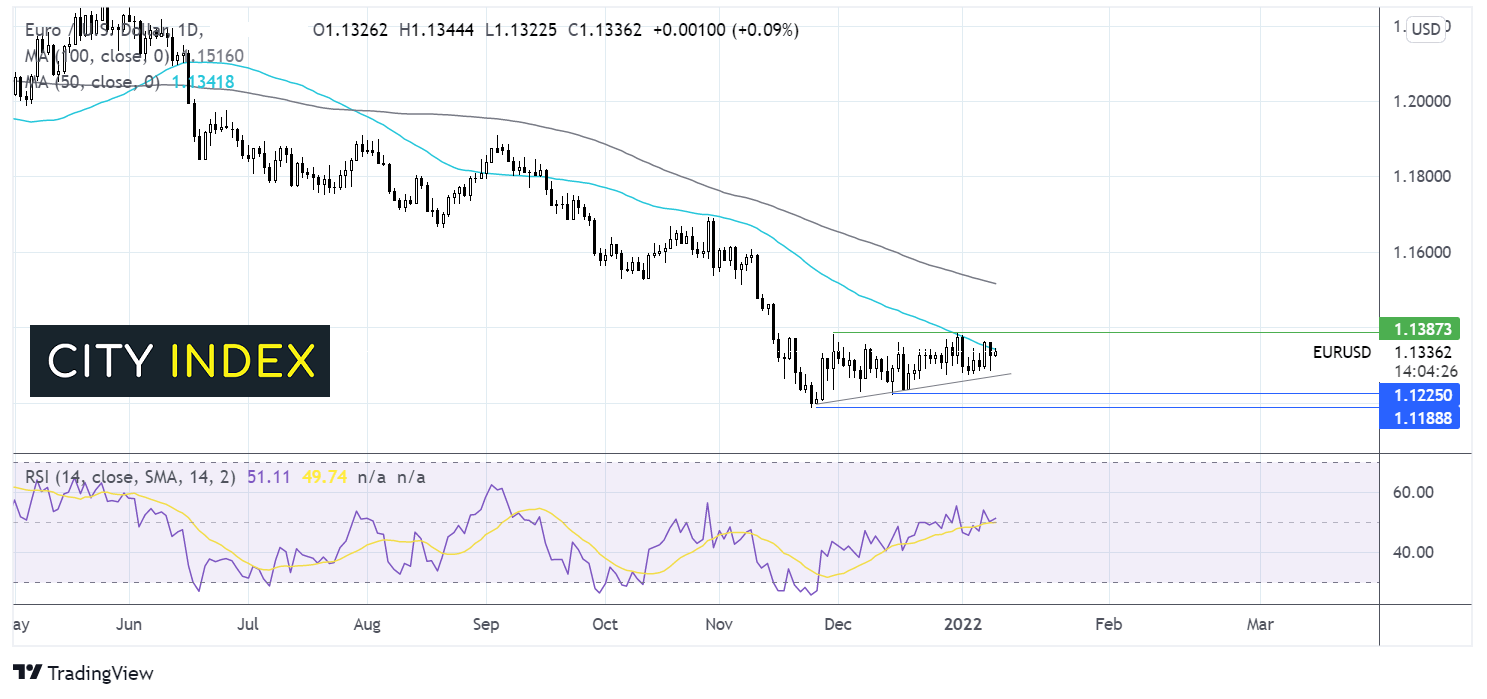
EURUSD continues to trade above a rising trendline dating back to late November. The price is testing the 50 sma resistance at 1.1340. A move above here is needed in order to target 1.1385 the January and December high. Above this level buyers could gain traction.
Support can be seen at 1.13 round number and 1.1280 the rising trendline support. In order for the bearish trend to resume, sellers will be looking for a move below 1.1186 the 2021 low.
US crude oil rises ahead of API stockpile data
US crude oil is on the rise, after two straight days of declines. Concerns over the demand outlook has weighed on the price of oil. However, developed economies are not imposing mobility restrictions despite surging Omicron infections, supporting oil prices.
OPEC+ is failing to reach its output quota following the increase in production agreement, which along with production disruptions in Libya is helping to keep oil prices buoyant.
API stockpile data is due. Expectations are for a 2-million-barrel draw. A larger than forecast draw could list oil prices higher.
Attention will also be on Fed Powell’s testimony which could drive movement in the USD.
Where next for WTI oil prices?
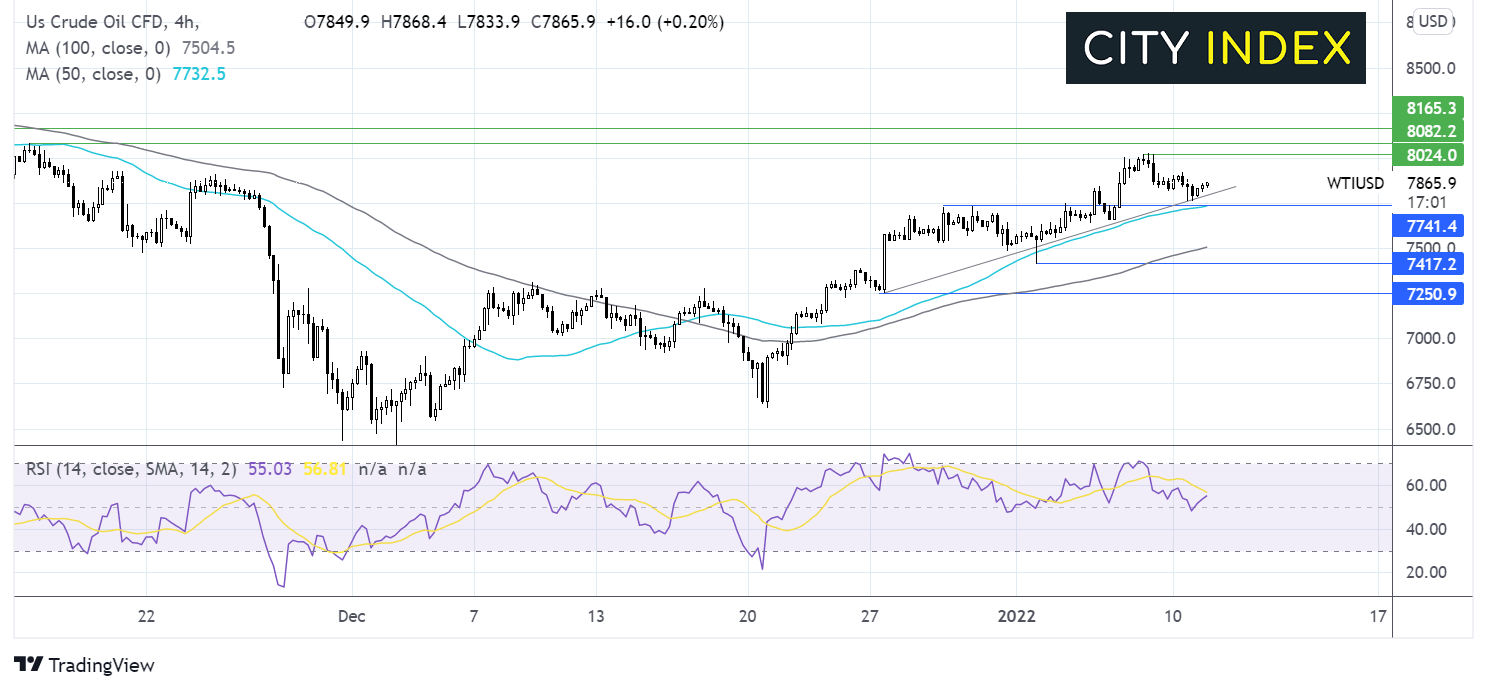
WTI oil price has been trending higher since late December, before running into resistance at 80.24. The price has since eased lower but remains above its 50 & 100 sma and its rising trendline dating back to late December. The RSI is also supportive of further upside.
Immediate resistance can be seen at 80.00/24 the psychological level, recent high. Beyond here 80.80 November 16 high comes into play.
On the flip side, support can be seen at 78.00 the rising trendline, ahead of 77.30 the 50 sma and December high and the 100 sna at 75.00.
How to trade with City Index
Follow these easy steps to start trading with City Index today:
- Open a City Index account, or log-in if you’re already a customer.
- Search for the market you want to trade in our award-winning platform.
- Choose your position and size, and your stop and limit levels
- Place the trade.
Latest market news
Today 04:00 PM
Today 01:15 PM
Today 11:30 AM
Today 08:18 AM
Latest Forex articles
Today 04:00 PM


Yesterday 11:30 AM