


EUR/USD holds uptrend
EUR/USD pushed higher in early trade to a peak, hitting fresh 32 month highs amid cautious progress of US stimulus bill.
However, the risk mood is easing as reflected in a lower open for EU indices, although the tone surrounding the safe haven US Dollar remains weak.
No Eurozone data is expected, US Chicago PMI & Pending Home Sales could entertain traders later this afternoon, although those are not expected to be market moving releases.
Expect thin trade with many European centres closed including Germany, Switzerland and Italy
Technical outlook
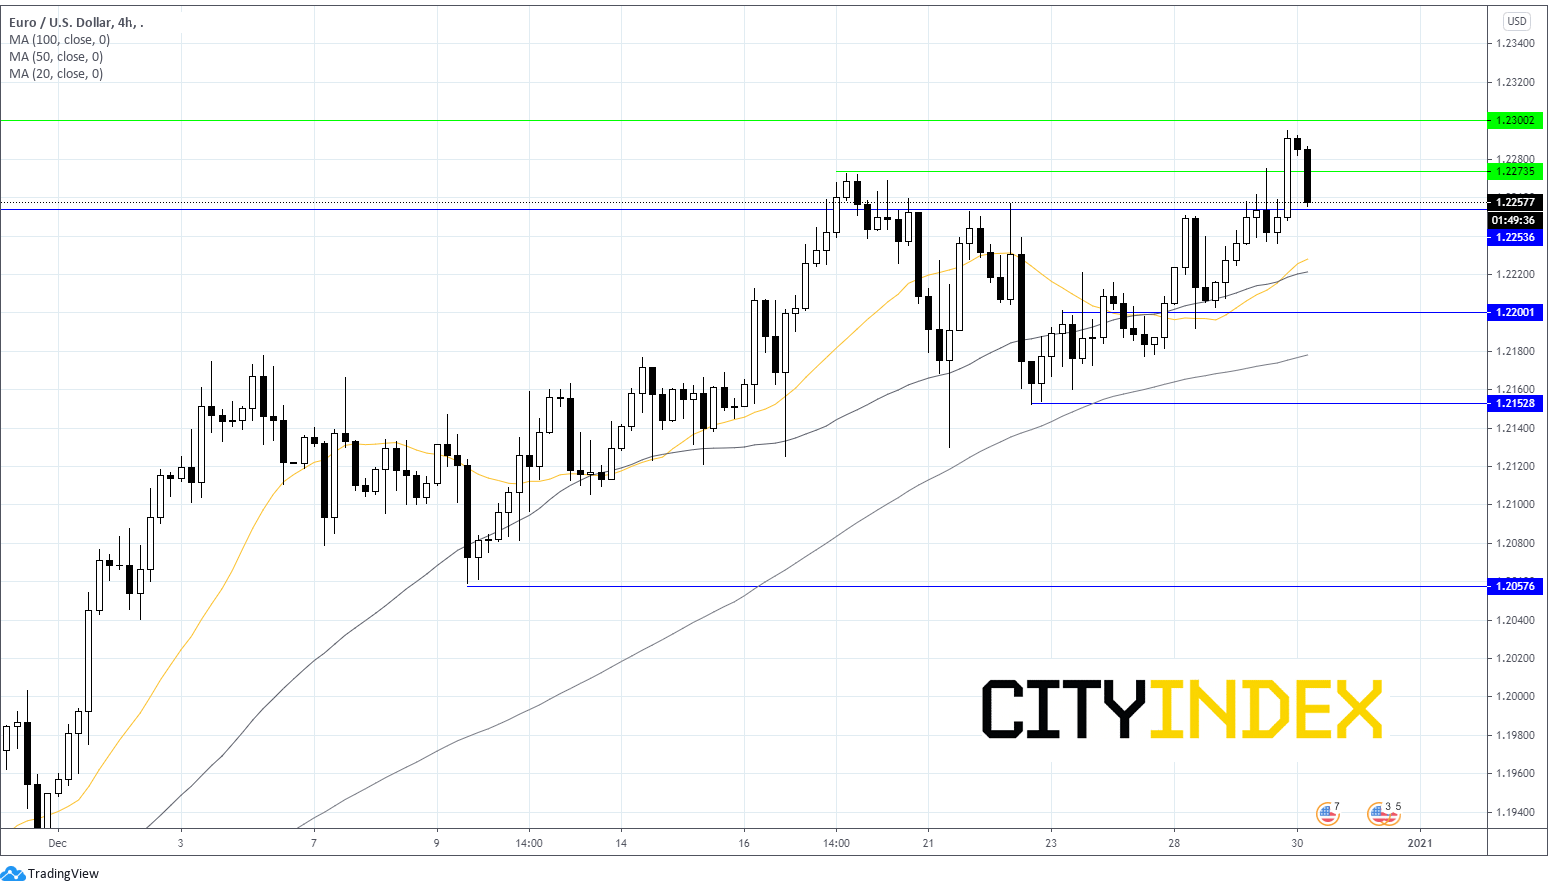
Technically, the pair trades comfortably over its 20,50 & 100 sma a bullish chart suggesting that more upside could be on the cards. Furthermore, the 20 sma has crossed above the 50 sma in another bullish signal.
Technically, the pair trades comfortably over its 20,50 & 100 sma a bullish chart suggesting that more upside could be on the cards. Furthermore, the 20 sma has crossed above the 50 sma in another bullish signal.
EUR/USD pushed over the monthly high 1.2275 in the previous session, however struggled to move beyond 1.2294 a fresh 32 month high overnight, instead rebounding lower.
The pair has crossed back below 1.2275 and is heading towards 1.2250 resistance turned support which has so far held. A break-through here could open the door to 1.2225/0 confluence 20 & 50 sma.
On the upside, a move towards the round number 1.23 could be eyed prior to 1.245
Learn more about trading forex.
On the upside, a move towards the round number 1.23 could be eyed prior to 1.245
Learn more about trading forex.
Where next for Taylor Wimpey as house price rise?
According to Nationwide, UK house prices climbed 7.5% in 2020 the highest growth rate in 6 years after demand was buoyed by the Chancellor’s stamp duty holiday, furlough scheme and changing preferences amid the pandemic.
However, the outlook is much more uncertain, depending on how the pandemic evolves and the economic scaring suffered. Whilst the stamp duty holiday continuing until March means prices could continue to increase in Q1, rising unemployment is the obvious risk.
Technical outlook
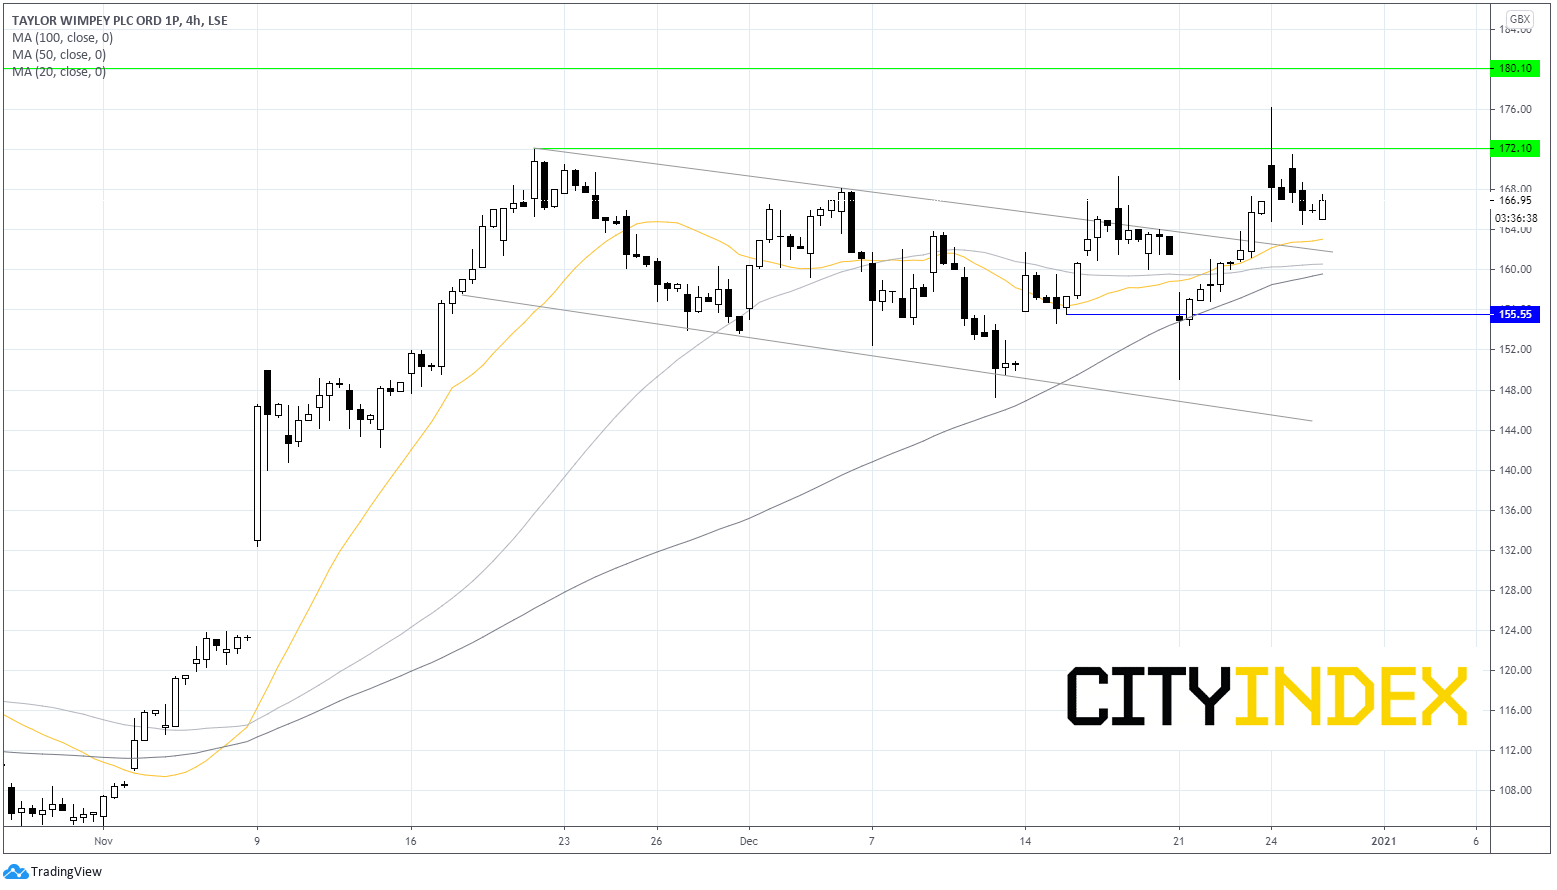
Taylor Wimpey rallied hard in early November on vaccine optimism hitting a high of 172 before trending lower from mid November to 23rd December. The stock broke out of its descending channel scaling to 176 on 24th December after the Brexit deal announcement.
The pair trades above its 20, 50 & 100 sma in a bullish sign although has failed to find acceptance above 172 which acts as the immediate resistance prior to 176 and the 9 month high of 180p.
163/1 offers important support with 20 sma and upper band of the descending channel. A break through there sees more support at 160/59 50 & 100 sma, prior to horizontal support at 155.
Learn more about trading equities
Latest market news
Today 04:00 PM
Today 01:15 PM
Today 11:30 AM
Today 08:18 AM