


March 19, 2021 2:27 PM
As one of the world’s most prominent social media companies, the Twitter price history has captivated speculators since the microblogging giant debuted on the stock market in 2013. And in 2021, the Twitter share price journey continues to evolve as new highs are achieved.
Here, find out more about the Twitter share price since IPO and discover the background of the business before its flotation.
Twitter price history chart
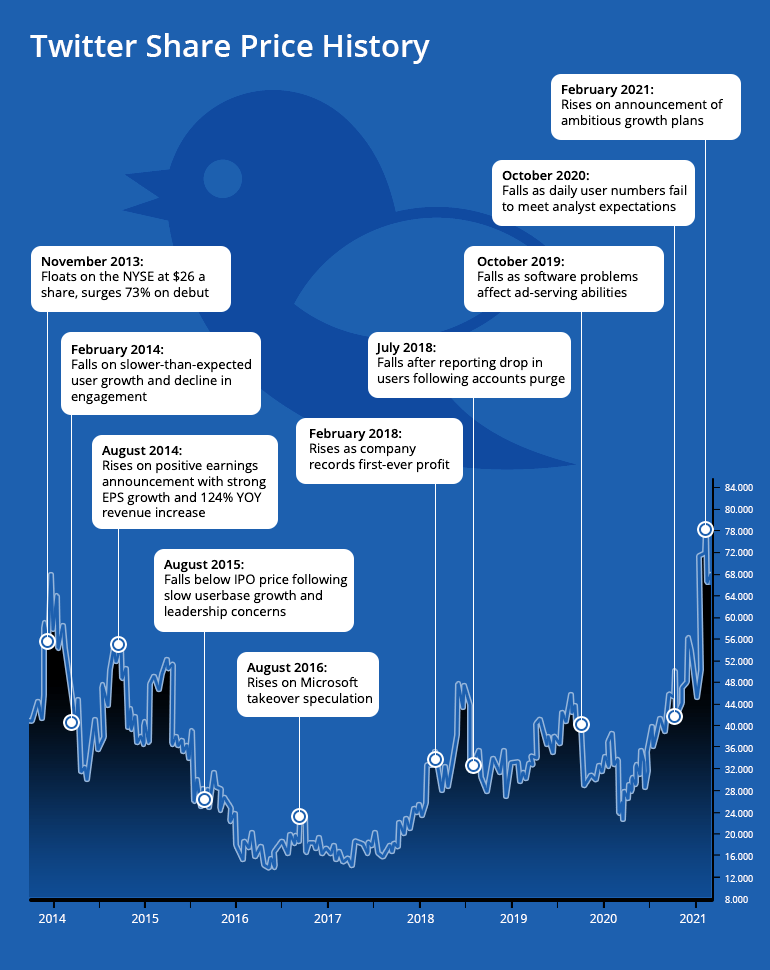
Take a look at the Twitter price history chart since 2013, from IPO through to the 2020 share price boom and beyond - and discover some of the fundamental drivers that impacted the stock's movements.
A brief history of Twitter
But first, let’s run through a brief history of Twitter and how we got here. The journey began in 2006 via a brainstorming session organised by board members of the podcasting company Odeo. Together, Biz Stone, Jack Dorsey, Noah Glass and Evan Williams conceptualised an SMS service to communicate with a small group, as opposed to individual recipients.
Later that year, Twitter launched to the public after spinning out of a company started by the Odeo board members. Following a successful trade conference, the number of tweets on the platform grew steadily to 400,000 per quarter in 2007. Twitter raised a $5 million round of Series A funding in July 2007 and, by 2008, the company had raised a series B round worth $15 million, with 100 million tweets being posted per quarter.
How did Twitter originally make money?
Twitter originally made money through search deals it completed with Google and Microsoft (worth $15 million and $10 million respectively), which paid Twitter for access to tweets that were in turn shown in search results on each site. In 2010 however, the company began selling advertisements on the platform, which would become its main revenue stream.
Fast forward to 2013 and Twitter launched its IPO on the New York Stock Exchange (NYSE). In 2020 the company’s annual revenues came to $3.72 billion, and as of 2019 the business employs some 4,900 people across 25 offices worldwide.
Discover the IPOs to watch out for in 2021.
Twitter share price history
Let’s take up the share price history from 2013, which marked the start of the share price journey, and discover the ups and downs on the road to global social media luminary.
November 2013: Twitter floats on NYSE
With 222 companies going public and raising some $55 billion, 2013 was a good year for IPOs. And November’s addition of Twitter to the NYSE was the most anticipated of all. The social network’s ascent to cultural force captivated market participants, with the opening price of $26 surging to almost $45 by the end of the trading day. In the event, only 70 million shares, or 13% of the company, were offered.
PRICE MOVE: +73% overnight
February 2014: Disappointing earnings report prompts early fall
Price growth in the early part of December 2013 stayed constant for Twitter as speculators continued to demonstrate the optimistic sentiment seen on flotation. But an early February drop of 23% followed the company’s first earnings report as a listed entity, which revealed stagnant user growth and a decline in engagement.
PRICE MOVE: -23% overnight
August 2014: Positive earnings announcement rouses bulls
After a year of ups and downs in 2014, Twitter’s share price got back on track with earnings revealing an EPS of 2 cents a share compared to a loss of 12 cents a share the year before – as well as a revenue boost to $312 million, marking a 124% improvement year on year.
PRICE MOVE: +7% on announcement
August 2015: Sluggish userbase growth sinks price
An unwanted milestone for Twitter came in August 2015 as the share price dipped below its original IPO price. The reason? A continuing problem with growing the userbase, despite the monetisation strategy taking shape. The company’s latest dip followed a period of decline that saw its value halve in just four months.
Additional concerns surrounding leadership, as well as the technical analysis harbingerer of doom the ‘Death Cross’, which revealed Twitter’s 50-day moving average crossing below the 100-day, completed the sombre picture.
PRICE MOVE: -34% over month
August 2016: Microsoft takeover speculation
Speculation arose that Microsoft could be set to buy Twitter when Microsoft CEO Steve Ballmer purportedly joined Saudi investor Prince Al-waleen Bin-Talal in a takeover bid. Other analysts offered that the real purchaser could instead be Google parent company Alphabet. In the end, nothing transpired of the deal, but the short-term share price lift caused by the rumour mill was notable.
PRICE MOVE: +5.25% overnight
February 2018: Rises as company records first-ever profit
A more positive milestone for Twitter bolstered a mostly-promising 2017 and start to 2018, when it posted its first profit of $91 million, a vast improvement on the $167 million loss the previous year. More good news came via earnings of 19 cents per share, beating a Wall Street forecast of 14 cents per share. Revenues also impressed, coming in at some $731 million and eclipsing estimates of $686 million from analysts.
PRICE MOVE: +4% on announcement
July 2018: Falls after reporting drop in 1 million users following its action to delete fake and offensive accounts.
In 2018, Twitter began to stamp down on fake accounts and accounts it deemed “offensive”, culminating in 70 million or so users being purged. The measures followed the discovery that 50,000 Russia-linked accounts had posted automated material about the 2016 US presidential election. Despite the active measures to clean up the userbase, market participants didn’t react favourably to the news, with around $6 billion wiped off its market cap.
PRICE MOVE: -20% overnight
October 2019: Falls as software problems affect ad-serving abilities
That fact that millions of new users joined Twitter didn’t ease the company’s share price downturn when technical glitches in its advertising software hit the company hard in October 2019. The setback caused some buyers to reduce spending and a profit tumble to just $37 million from $789 million the year before certainly didn’t help the share price either.
PRICE MOVE: -19% overnight
October 2020: Falls as daily user numbers fail to meet analyst expectations
October 2020 saw Twitter announcing impressive third-quarter earnings of some $936 million vs $777 million predicted, but this and a strong EPS failed to convince speculators that weak user growth wasn’t the main story. Analysts’ expectations for 10 million new users in the quarter were met by an actual figure of a disappointing 1 million, compared to 20 million added during the second quarter.
PRICE MOVE: -19% overnight
February 2021: Ambitious growth plans prompt bullish surge
February 2021 marked the announcement of three long-term goals that inspired confidence in Twitter speculators. First up, the plan to at least double total annual revenue from $3.7 billion in 2020 to $7.5 billion or more by 2023. Next, the goal of 315 million daily active users by Q4 2023, and finally, the vision to build the number of features shipped per employee that directly drive either daily active users or revenue. Together, it all made for a vote of confidence among the bulls.
PRICE MOVE: +3.7% on announcement
How to trade top stocks
You can trade stocks with City Index using spread bets or CFDs, with spreads from 0.1%. Follow these easy steps to start trading opportunities with UK stocks.
- Open a City Index account, or log in if you’re already a customer.
- Search for the company you want to trade in our award-winning platform
- Choose your position and size, and your stop and limit levels
- Place the trade
Latest market news
Yesterday 03:00 PM
Yesterday 01:12 PM
Yesterday 11:14 AM
Yesterday 08:28 AM
April 24, 2024 03:30 PM
Latest Insights articles
March 21, 2024 04:05 AM
February 12, 2024 02:44 PM
February 9, 2024 04:37 PM
February 8, 2024 06:25 PM