


High-sulphur content of recent discovery triggers second output estimate cut in four months
There are few equity sectors more volatile right now than mid-cap oil shares, as Wednesday’s seismic drop by Tullow shows. Shares in the £2.1bn FTSE 250 firm fell as much as 27% after it announced a reassessment of the viability of recent discoveries in South America. Hopes about the two prospects in Guyana had been high, amid uncertainty on existing ventures. But crude from the discoveries was found to be ‘heavy’, meaning it has a high sulphur content. That makes it more difficult to refine, extract and transport, raising costs and lowering profits. The latest issues come on top of technical difficulties Tullow encountered with projects in Ghana, Uganda and Kenya. Some investors have complained that the group has provided few details about the quality of heavy oil in Guyana, fuelling concerns over the value of its assets there.
The group also slashed 2019 output forecasts by about 6.5% on Wednesday, due to African difficulties, now expecting to produce 87,000 barrels a day, on average, versus 93,000/bbl. day previously. It’s the second production estimate cut in four months.
Tullow’s latest challenges add to a stream of upsets stemming from the 2014-2016 oil price collapse which the stock has not fully recovered from. The group remains saddled with debt, for one thing. Its leverage is a punishing 3 times the level of underlying earnings generated over the last twelve months. The average for an oil firm of Tullow’s size is about 1.1 times. With fresh production snags also now weighing on free cash flow expectations, it remains difficult to envisage the shares making sustainable upside progress in the near term.
Chart points
From an all-time peak of about 1550p in 2012, Tullow reached a rock-bottom of 116p in January 2016. The best the shares have managed since then was a cycle high of 351p in January 2017. Steady progress within that range since then has been dealt a blow by the share’s most searing drop since October 1998. Even on the simple weekly chart below we can see that the stock managed to stop short of its 142p low, notched during the week beginning 18th June 2017. That price was the ‘kickback’ point from which a clear uptrend (now superseded) was launched. We can therefore assume some measure of support would be evident if the stock gets there again. Given that the weekly RSI momentum gauge is slumping though not yet oversold, it’s not a punchy call to see a new 2½-year low in coming sessions. And If 142p does give way, the next logical low to watch would be 116p. Still, sellers ought to remember that nearby floors as well as the range spanning roughly 116p-155p, constitute implied support.
Tullow Oil Plc. DFT – Weekly
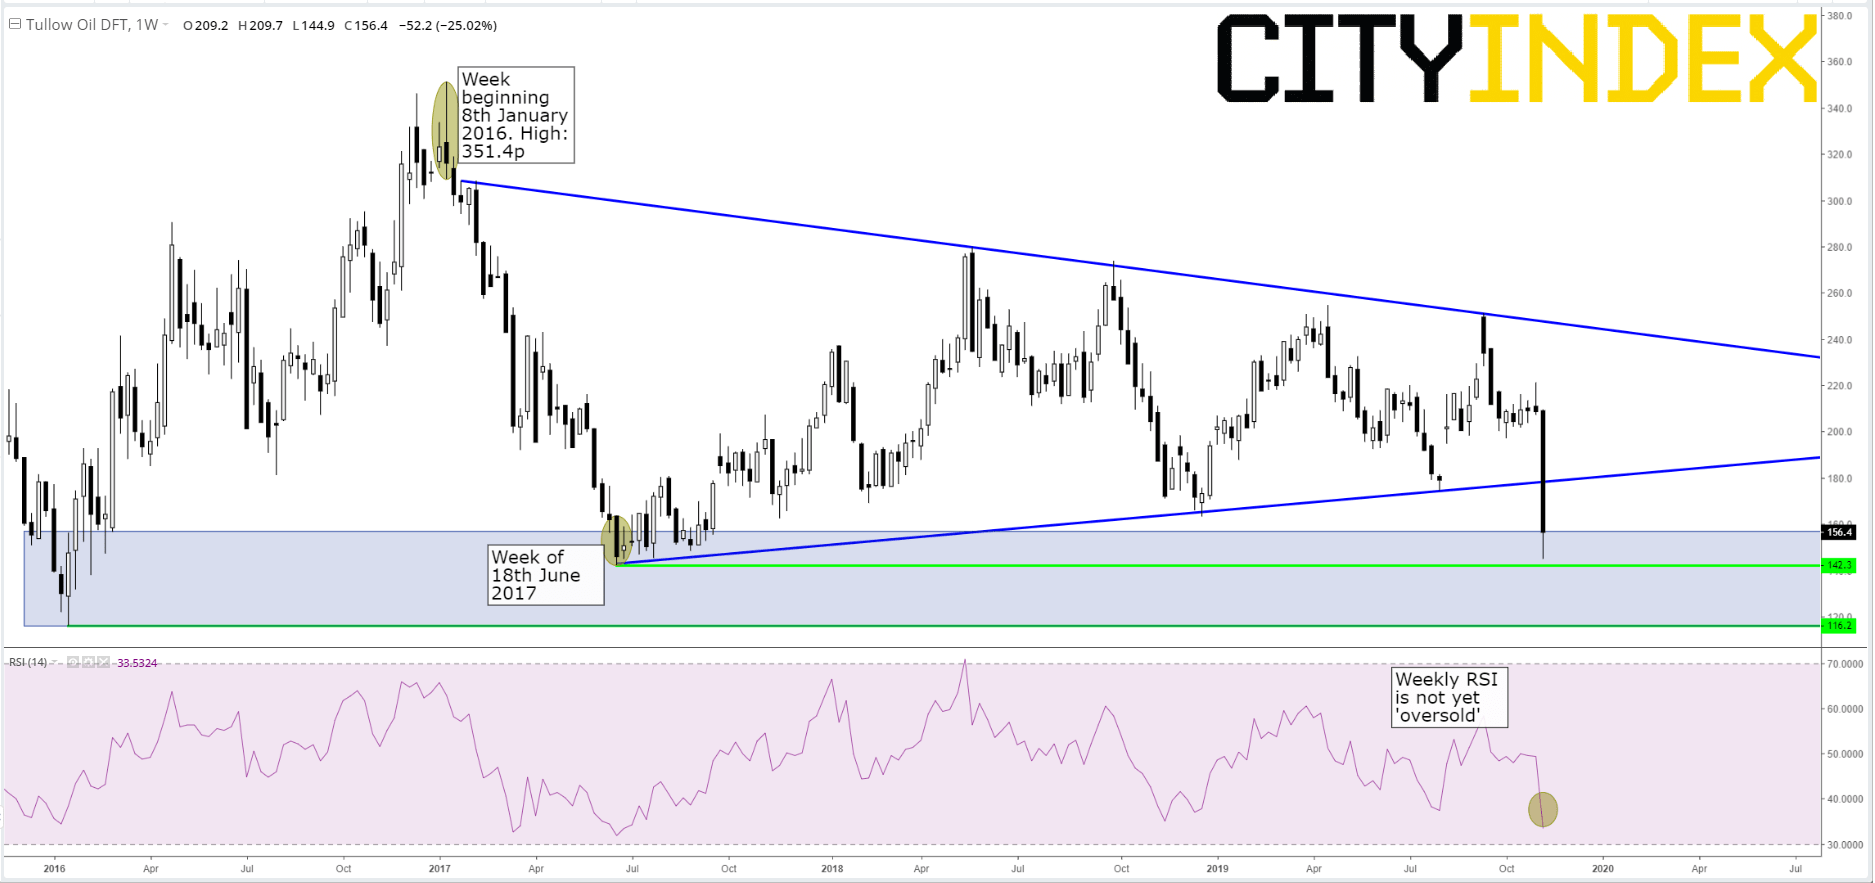
Source: City Index
Latest market news
Today 01:15 PM
Today 11:30 AM
Today 08:18 AM
Latest Crude Oil articles
Yesterday 04:00 PM
April 19, 2024 03:35 AM
April 17, 2024 05:00 PM
April 17, 2024 03:02 AM