Time to buy Gold
Gold prices have dropped lower by 11% over 10 weeks. Despite the uncertainty in the global markets, the metal seems to have lost its shine. […]
Gold prices have dropped lower by 11% over 10 weeks. Despite the uncertainty in the global markets, the metal seems to have lost its shine. […]
Traders and investors often look towards gold prices as an indicator of sentiment. Given the bearish news that we have seen over recent months, one would think that gold would have at least reached the $2,000 level by now. But of course the exact opposite has occurred and now some traders are left wondering if there is much upside left at all.
Whether we see $2,000 per ounce remains to be seen, but what is important is the trend that is dominating the commodity right now.
January 2012 started on a positive note, with the metal trading at $1,572 per ounce. Within one month gold had gained over 10% and continued to make a higher high into February before turning sharply lower.
In fact on February 29, gold did lose its shine by dropping more than -$90.00 on an intraday basis.
From a high of $1,795 and closing at $1,699, we have since seen gold head lower and shed 11% from its highs. Along the way gold tested two support levels of $1,660 followed by the more significant level of $1,630 before falling lower.
As highlighted in my weekly market reports, I warned of the importance of maintaining a firm hold above $1,630, which the commodity attempted on five occasions before finally breaking below its support level to aim for $1,585 as outlined in the Week Ahead Reports. See key levels for major markets.
So does this mean that gold has now turned long term bearish?
Much will depend on how gold reacts at the current support level of $1,585 and if we can see a move higher from this level. More importantly, from a classical Technical Analysis basis, we would need to see a low form at support followed by higher highs and higher lows. This is one of the important concepts that is taught to new traders who are looking to spread bet or trade CFDs and forex.
By taking a look at the recent chart of gold, we can see straight away with using and Technical Indicators and simply observing Price Action that the chart itself has provided a clear indication of the current trend.
Gold (Daily)
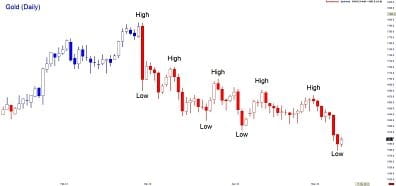
Traders often get into analysis paralysis by overcomplicating the process of charting. It is far easier on the eye when charts are kept simple and clean. Using the concept of lower highs and lower lows one can easily see that the trend remains bearish until the market proves otherwise.
This is not to say that Technical Indicators do not work. If used in the correct manner and with the right approach, indicators can be helpful. In future articles I will demonstrate how to use indicators in a simple and effective way.
So if we see gold find support at $1,585 and then form a higher high followed by a higher low then the time to get bullish on gold may be around the corner. Of course this does not mean that gold has made a bottom but more importantly, it provides a structure with which to work.
We can get more precise on entries by adopting the use of Candlestick patterns to provide good Risk to Reward Ratios.
Learn how to trade High Probability Trading Strategies with City Index Seminars.
Over the coming week, I shall be watching gold to see if the commodity provides us with an opportunity to trade and also to see if gold has indeed started the process of forming an important low. If gold fails to hold $1,585 then the bears are likely to take the commodity to lower prices, creating a lower low.
Patience is required and the discipline to wait for the right opportunity is needed to ensure we stick with a trading plan. Have a safe trading day.
