


This Week's Big Earnings and Market Forecast
On Tuesday, Walmart (WMT), the retail giant, is awaited to post second quarter EPS of $1.25 compared to $1.27 a year ago on revenue of $135 billion vs $130.4 billion last year. The expected move based on front-month options is 5.3%, the last time the Co reported earnings the stock declined 2.1%. Technically speaking, the RSI is above 70. It could mean either that the stock is in a lasting uptrend or just overbought and therefore bound to correct (look for bearish divergence in this case). The MACD is above its signal line and positive. The configuration is positive. Moreover, the stock is above its 20 and 50 day MA (respectively at 246.45 and 217.1).
Same day, Home Depot (HD), the home improvement specialty retailer, is likely to unveil second quarter EPS of $3.48 vs $3.17 last year on sales of $33.6 billion compared to $30.8 billion a year ago. The Co is also anticipated to move up or down by 5.3% based on options volatility. The Stock slid 3% after they last reported earnings. From a chartist's point of view, price remains supported by its 20-day moving average in an uptrend. The MACD is positive and above its signal line. The configuration is positive. Moreover, the stock is above its 20 and 50 day MA (respectively at 265.72 and 255.71).
On Wednesday, Nvidia (NVDA), a leading designer of graphics processors, is expected to announce second quarter EPS of $1.97 compared to $1.24 a year ago on revenue of $3.6 billion vs $2.6 billion last year. Traders are anticipating a move around 9.4%. The stock gained 2.9% after last earnings were reported. From a technical point of view, the RSI is above its neutrality area at 50. The MACD is above its signal line and positive. The configuration is positive. Moreover, the stock is trading above both its 20 and 50 day MA (respectively at 427.57 and 397.93).
Same day, Target (TGT), a leading general merchandise discount retailer is anticipated to release second quarter EPS of $1.48 vs $1.82 last year on sales of $19.4 billion compared to $18.4 Billion a year ago. Target may move 6.8% on earnings compared to a drop of 2.9% after Q1. Looking at a daily chart, the stock broke above key resistance at 128.6 that has now become support. An uptrend may be in play. The MACD is above its signal line and positive. The configuration is positive. Moreover, the stock is above its 20 and 50 day MA (respectively at 124.74 and 121.51).
Looking at the S&P 500 CFD on a 30 minute chart, the index has continued to rise and is currently holding just below its all time high of 3397.00. The index will likely chop around before attempting to retest the 3397.00 level. If price reaches and breaks the record high, the index will probably continue upwards to 3422.00. Even if the index pulls back we could see a bounce off of 3355.00 or 3326.00.
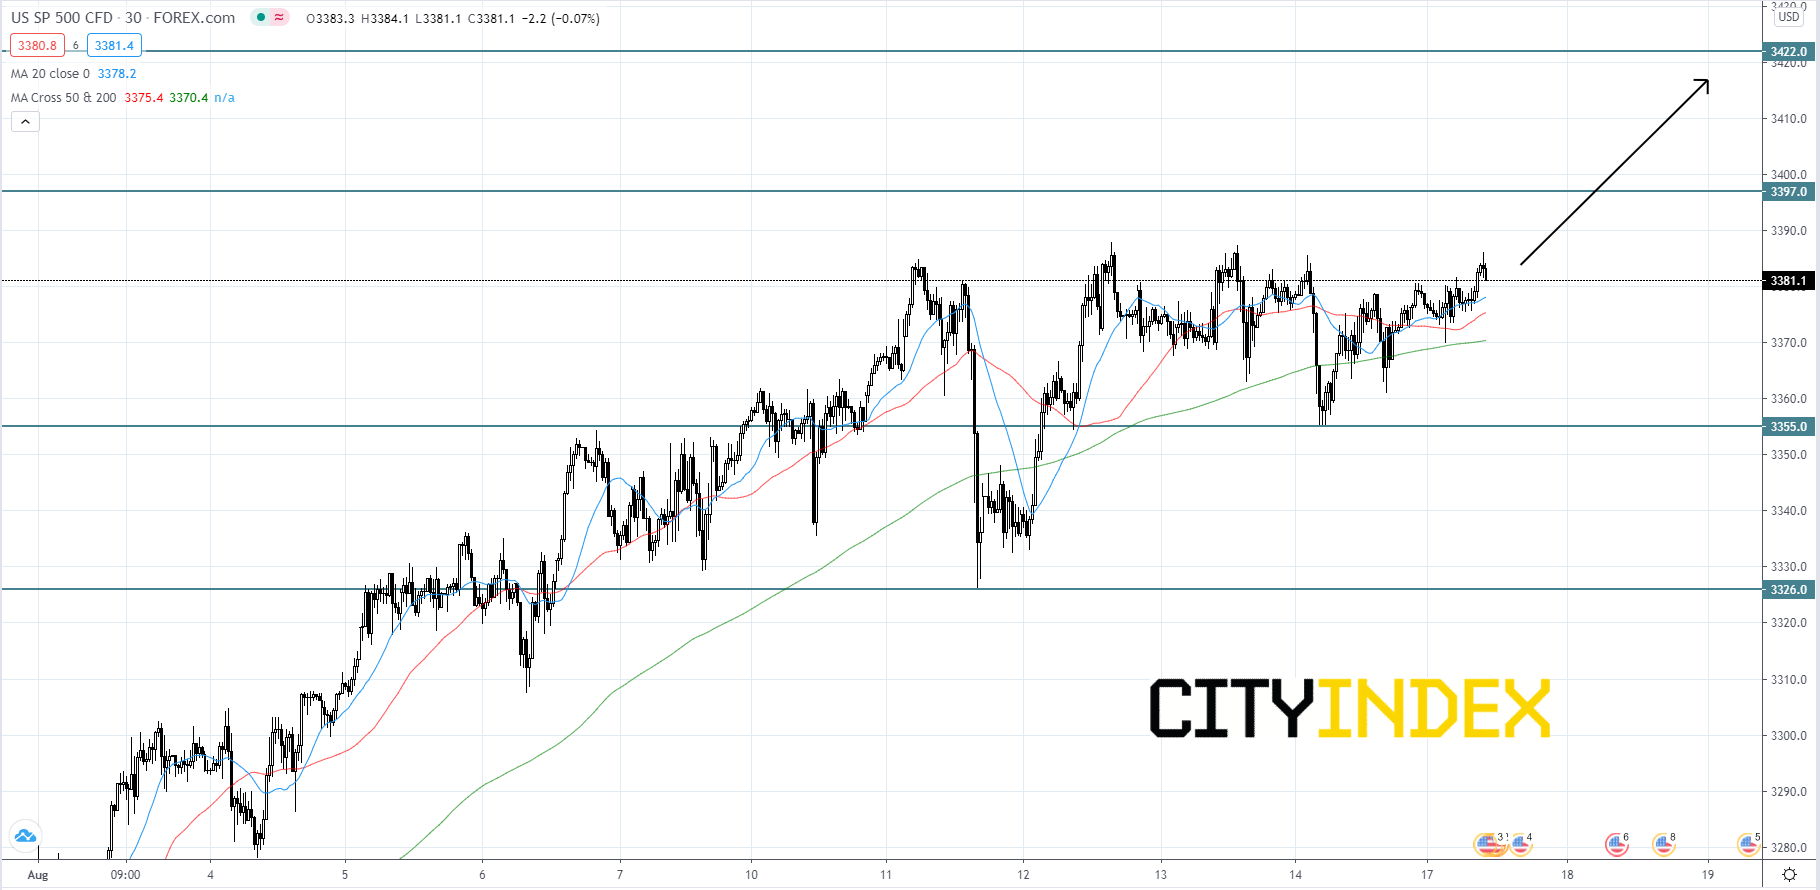
Source: GAIN Capital, TradingView
Same day, Home Depot (HD), the home improvement specialty retailer, is likely to unveil second quarter EPS of $3.48 vs $3.17 last year on sales of $33.6 billion compared to $30.8 billion a year ago. The Co is also anticipated to move up or down by 5.3% based on options volatility. The Stock slid 3% after they last reported earnings. From a chartist's point of view, price remains supported by its 20-day moving average in an uptrend. The MACD is positive and above its signal line. The configuration is positive. Moreover, the stock is above its 20 and 50 day MA (respectively at 265.72 and 255.71).
On Wednesday, Nvidia (NVDA), a leading designer of graphics processors, is expected to announce second quarter EPS of $1.97 compared to $1.24 a year ago on revenue of $3.6 billion vs $2.6 billion last year. Traders are anticipating a move around 9.4%. The stock gained 2.9% after last earnings were reported. From a technical point of view, the RSI is above its neutrality area at 50. The MACD is above its signal line and positive. The configuration is positive. Moreover, the stock is trading above both its 20 and 50 day MA (respectively at 427.57 and 397.93).
Same day, Target (TGT), a leading general merchandise discount retailer is anticipated to release second quarter EPS of $1.48 vs $1.82 last year on sales of $19.4 billion compared to $18.4 Billion a year ago. Target may move 6.8% on earnings compared to a drop of 2.9% after Q1. Looking at a daily chart, the stock broke above key resistance at 128.6 that has now become support. An uptrend may be in play. The MACD is above its signal line and positive. The configuration is positive. Moreover, the stock is above its 20 and 50 day MA (respectively at 124.74 and 121.51).
Looking at the S&P 500 CFD on a 30 minute chart, the index has continued to rise and is currently holding just below its all time high of 3397.00. The index will likely chop around before attempting to retest the 3397.00 level. If price reaches and breaks the record high, the index will probably continue upwards to 3422.00. Even if the index pulls back we could see a bounce off of 3355.00 or 3326.00.
Source: GAIN Capital, TradingView
Latest market news
Latest Equities articles
April 12, 2024 02:28 AM
April 7, 2024 08:46 PM
March 31, 2024 11:22 AM
