


The S&P 500 Remains in Consolidation
On Tuesday, Salesforce.com (CRM) is awaited to post third quarter EPS of $0.75, in line with the year before on revenue of $5.3 billion vs $4.5 billion last year. The Co develops business software and on November 25th, Dow Jones reported that the Co has been in talks to acquire Slack Technologies (WORK), the collaboration hub. Technically speaking, the RSI is below its neutrality area at 50. The MACD is positive and above its signal line. The break above the 50 area on the RSI would call for further upside. Moreover, the stock is trading under both its 20 and 50 day MA (respectively at $251.07 and $251.21). We are looking at the final target of $215.60 with a stop-loss set at $280.20.
On Wednesday, Five Below (FIVE) is likely to unveil third quarter EPS of $0.19 vs $0.18 last year on revenue of $445.3 million compared to $377.4 million a year ago. The Co operates a chain of value-oriented retail stores and its price is expected to move up or down by 9.3% based on options volatility. The stock jumped 8.6% after the Co last reported earnings. From a chartist's point of view, the RSI is above 50. The MACD is above its signal line and positive. The configuration is positive. Moreover, the stock is above its 20 and 50 day MA (respectively at $140.6 and $135.12). We are looking at the final target of $171.80 with a stop-loss set at $146.00.
Also on Wednesday, Synopsys (SNPS) is expected to announce fourth quarter EPS of $1.56 compared to $1.15 a year ago on revenue of $1.0 billion vs $851.1 million the year before. The Co develops electronic products and software, and on November 19th, the Co announced that it acquired Light Tec, a provider of optical scattering measurements and measurement equipment. In other news, on November 11th, the Co also acquired Moortec, a provider of inchip monitoring technology. The terms of both deals were not disclosed. From a technical point of view, the RSI is below its neutrality area at 50. The MACD is below its signal line and positive. The MACD must penetrate its zero line to expect further downside. Moreover, the stock is trading under its 20 day MA ($224.48) but above its 50 day MA ($218.16). We are looking at the final target of $193.80 with a stop-loss set at $231.20.
On Thursday, Marvell Technology Group (MRVL) is anticipated to release third quarter EPS of $0.25 vs $0.17 last year on revenue of $751.0 million compared to $662.5 million a year ago. The Co designs integrated circuits primarily for data storage, networking, and communications, and on November 17th, the Co revealed the industry's first 112G 5nm SerDes solution in hardware form for cloud data center infrastructure. In other news, on November 2nd, Bloomberg disclosed that the Co entered into an agreement to acquire Inphi Corp., a producer of specific semiconductor components and optical subsystems, for approximately $8.2 billion in cash and stock. Looking at a daily chart, the RSI is above its neutrality area at 50. The MACD is positive and above its signal line. The configuration is positive. Moreover, the stock is trading above both its 20 and 50 day MA (respectively at $40.94 and $40.65). We are looking at the final target of $50.10 with a stop-loss set at $39.80.
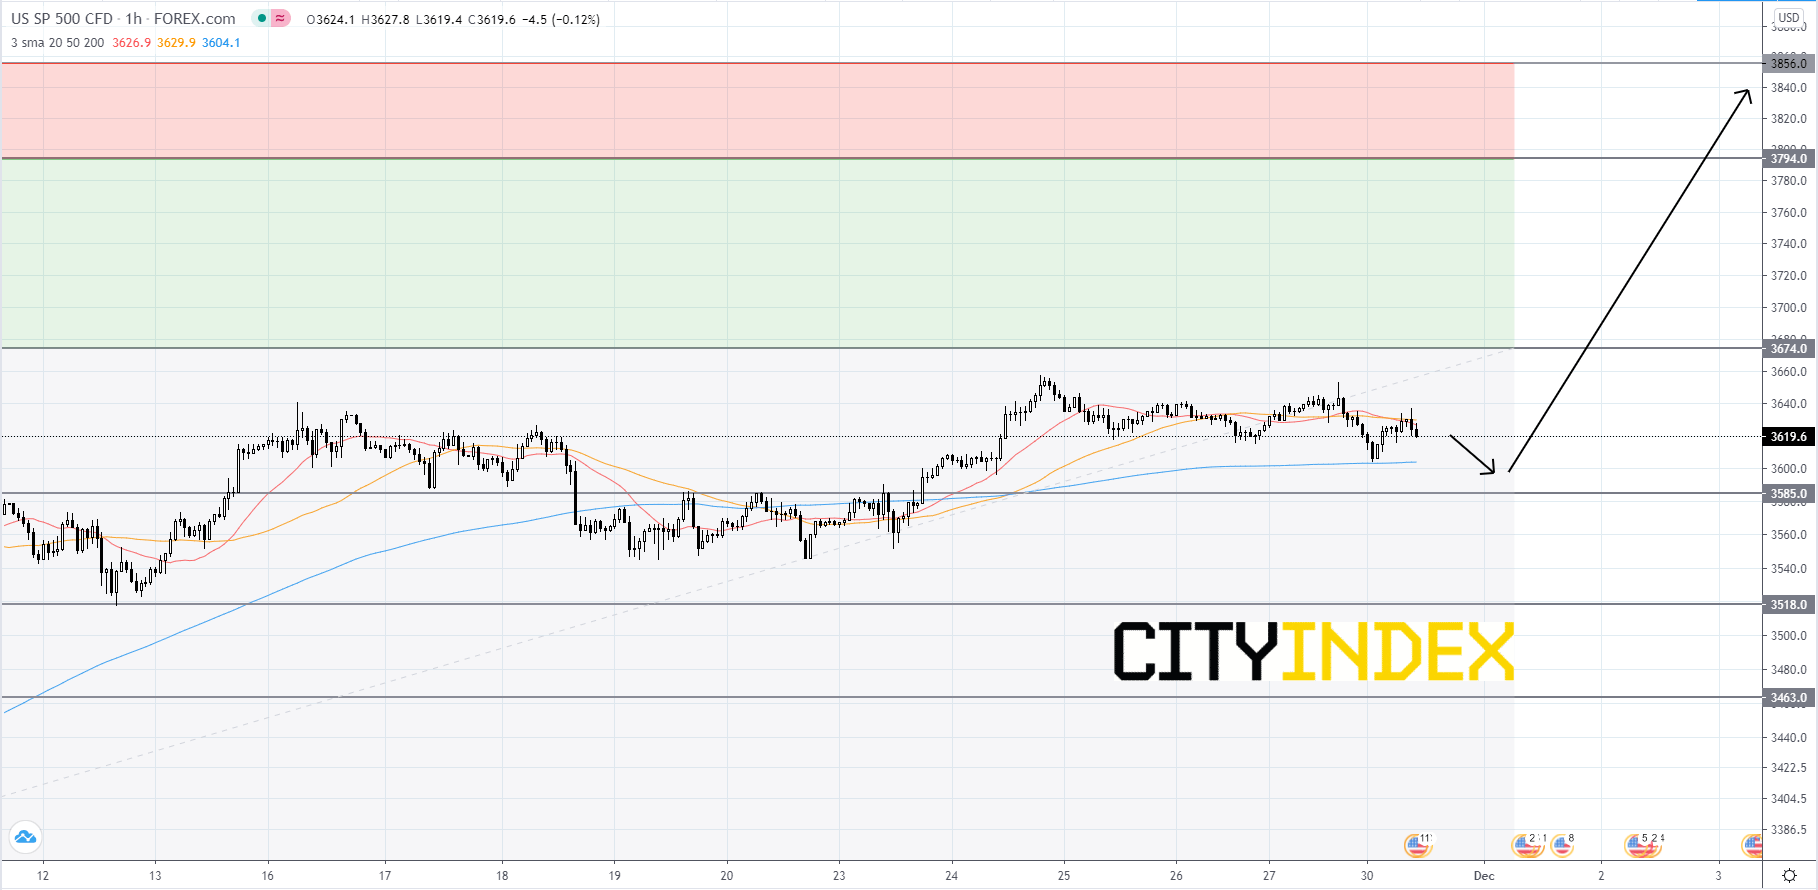
Looking at the S&P 500 CFD on a 1 hour chart, the index remains in consolidation after making a record high of 3,673.90 on Monday, November 9th. The index will likely continue to chop around between 3,585.00 and 3,674.00 until a breakout occurs. If price can get above 3,674.00, it would be a bullish signal that would send price towards its first Fibonacci target of 3,794.00. If price reaches 3,794.00, then its next target would be 3,856.00. If price falls below 3,585.00, then traders should look to 3,518.00 for a bounce. If price fails to be supported at 3,518.00 it would be a bearish signal, as 3,518.00 has acted as strong support since November 10th. Finally, if price breaks below 3,463.00, it could be the beginning of a new short-term down trend.
Source: GAIN Capital, TradingView
On Wednesday, Five Below (FIVE) is likely to unveil third quarter EPS of $0.19 vs $0.18 last year on revenue of $445.3 million compared to $377.4 million a year ago. The Co operates a chain of value-oriented retail stores and its price is expected to move up or down by 9.3% based on options volatility. The stock jumped 8.6% after the Co last reported earnings. From a chartist's point of view, the RSI is above 50. The MACD is above its signal line and positive. The configuration is positive. Moreover, the stock is above its 20 and 50 day MA (respectively at $140.6 and $135.12). We are looking at the final target of $171.80 with a stop-loss set at $146.00.
Also on Wednesday, Synopsys (SNPS) is expected to announce fourth quarter EPS of $1.56 compared to $1.15 a year ago on revenue of $1.0 billion vs $851.1 million the year before. The Co develops electronic products and software, and on November 19th, the Co announced that it acquired Light Tec, a provider of optical scattering measurements and measurement equipment. In other news, on November 11th, the Co also acquired Moortec, a provider of inchip monitoring technology. The terms of both deals were not disclosed. From a technical point of view, the RSI is below its neutrality area at 50. The MACD is below its signal line and positive. The MACD must penetrate its zero line to expect further downside. Moreover, the stock is trading under its 20 day MA ($224.48) but above its 50 day MA ($218.16). We are looking at the final target of $193.80 with a stop-loss set at $231.20.
On Thursday, Marvell Technology Group (MRVL) is anticipated to release third quarter EPS of $0.25 vs $0.17 last year on revenue of $751.0 million compared to $662.5 million a year ago. The Co designs integrated circuits primarily for data storage, networking, and communications, and on November 17th, the Co revealed the industry's first 112G 5nm SerDes solution in hardware form for cloud data center infrastructure. In other news, on November 2nd, Bloomberg disclosed that the Co entered into an agreement to acquire Inphi Corp., a producer of specific semiconductor components and optical subsystems, for approximately $8.2 billion in cash and stock. Looking at a daily chart, the RSI is above its neutrality area at 50. The MACD is positive and above its signal line. The configuration is positive. Moreover, the stock is trading above both its 20 and 50 day MA (respectively at $40.94 and $40.65). We are looking at the final target of $50.10 with a stop-loss set at $39.80.
Looking at the S&P 500 CFD on a 1 hour chart, the index remains in consolidation after making a record high of 3,673.90 on Monday, November 9th. The index will likely continue to chop around between 3,585.00 and 3,674.00 until a breakout occurs. If price can get above 3,674.00, it would be a bullish signal that would send price towards its first Fibonacci target of 3,794.00. If price reaches 3,794.00, then its next target would be 3,856.00. If price falls below 3,585.00, then traders should look to 3,518.00 for a bounce. If price fails to be supported at 3,518.00 it would be a bearish signal, as 3,518.00 has acted as strong support since November 10th. Finally, if price breaks below 3,463.00, it could be the beginning of a new short-term down trend.
Source: GAIN Capital, TradingView
Latest market news
Yesterday 03:30 PM
Yesterday 01:23 PM
Yesterday 11:00 AM
Yesterday 08:15 AM
Latest SPX 500 articles
Yesterday 01:23 PM
April 19, 2024 01:23 PM
April 18, 2024 04:46 PM
April 16, 2024 04:54 PM