
The S&P 500 Is Under Pressure
On Tuesday, Microsoft (MSFT) is anticipated to release first quarter EPS of $1.55 vs $1.38 last year on revenue of $35.8 billion compared to $33.1 billion a year ago. The Co develops software and on October 22nd, the Co announced that it established a new digital alliance with the state of Texas to create programs and events that will create new economic opportunities and help prepare a workforce for the 21st century. In other news, on October 21st, The Wall Street Journal reported that the Co teamed up with Elon Musk's SpaceX in order to deploy new services and expand its presence in the space industry. Looking at a daily chart, the RSI is mixed with a bullish bias. We are looking at the final target of $250.00 with a stop-loss set at $205.00.
On Wednesday, United Parcel Service (UPS) is expected to announce third quarter EPS of $1.89 compared to $2.07 a year ago on revenue of $20.3 billion vs $18.3 billion last year. UPS is the world's largest parcel delivery company and on October 5th, Bloomberg reported that the Supreme Court denied an appeal from the Co, leaving it to award N.Y. state and city with $100 million won in a case regarding shipments of contraband cigarettes. From a technical point of view, the RSI is above its neutrality area at 50. The MACD is below its signal line and positive. The stock could retrace in the short term. Moreover, the stock is trading under its 20 day MA ($172) but above its 50 day MA ($165.03). We are looking at the final target of $183.30 with a stop-loss set at $167.20.
On Thursday, Amazon.com (AMZN) is likely to unveil third quarter EPS of $7.33 vs $4.23 last year on sales of $92.2 billion compared to 70.0 billion a year ago. The Co is the world's largest online retailer and web services provider, and on October 21st, the Co revealed that its prime members can now get free one-hour pick ups on orders at all Whole Foods stores in the United States. In other news, on October 16th, the Co announced that it plans to open two new fulfillment centers in Kansas in 2021, creating over 1,000 new jobs. From a chartist's point of view, the RSI is below its neutrality area at 50. The MACD is positive and below its signal line. The MACD must penetrate its zero line to expect further downside. Moreover, the share stands below its 20 and 50 day MA (respectively at $3,229.75 and $3,226.74). We are looking at the final target of $2,791.00 with a stop-loss set at $3,350.00.
On Friday, AbbVie (ABBV) is awaited to post third quarter EPS of $2.77 compared to $2.33 a year ago on revenue of $12.7 billion vs $8.5 billion last year. AbbVie is a biopharmaceutical company and on October 19th, the Co submitted applications to the U.S. Food and Drug Administration (FDA) and the European Medicines Agency (EMA) seeking approval for RINVOQ (upadacitinib) for the treatment of adolescents and adults with moderate to severe atopic dermatitis. Technically speaking, the RSI is below 50. The MACD is below its signal line and negative. The configuration is negative. Moreover, the share stands below its 20 and 50 day MA (respectively at $85.52 and $88.66). We are looking at the final target of $79.40 with a stop-loss set at $87.20.
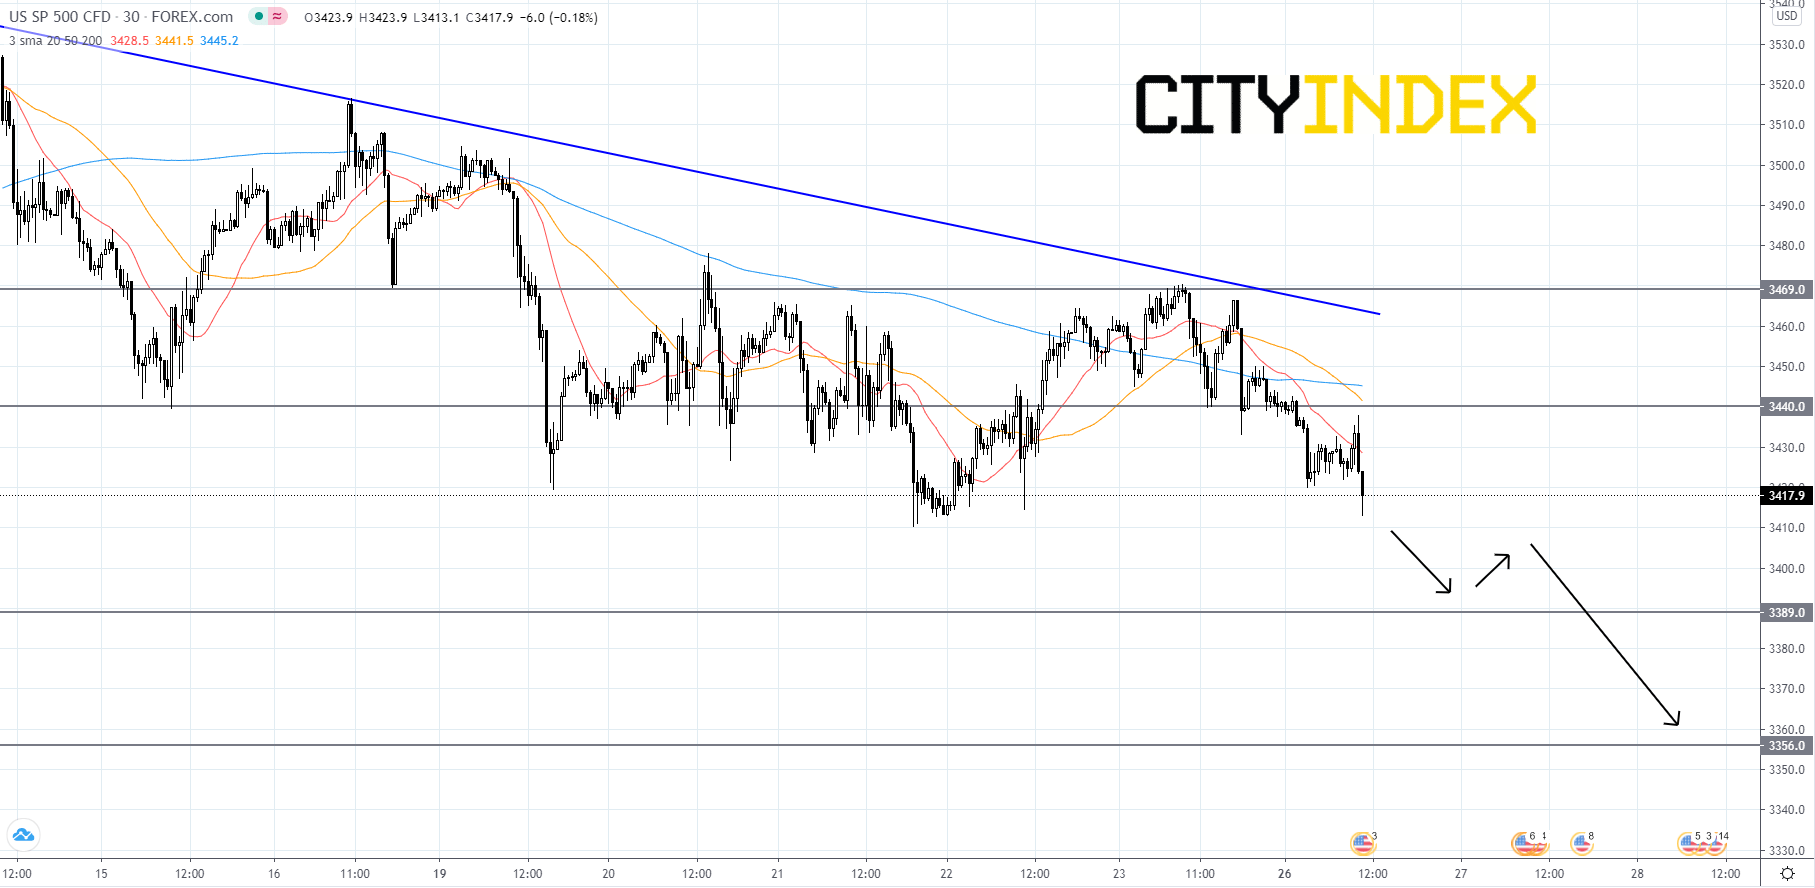
Looking at the S&P 500 CFD on a 30 minute chart, the index has been falling in a short-term downtrend since price last peaked at 3,550.00 on October 12th. Price will likely continue its decline and fall to the first support level of 3,389.00. At 3,389.00 the index will probably find some support and bounce. After the bounce price will most likely fade and breakout to the downside of 3,389.00. If price breaks below 3,389.00 then its next target would be 3,356.00. If price breaks below 3,356.00 it would be a bearish signal that could send the index tumbling further. On the other hand, if the index finds strong support at 3,389.00 and manages to get above 3,440. it could retest the bearish trendline. If the index can manage to breakout to the upside of the bearish trendline it would be a bullish signal that could send price back up to 3,469.00 and higher.
Source: GAIN Capital, TradingView
On Wednesday, United Parcel Service (UPS) is expected to announce third quarter EPS of $1.89 compared to $2.07 a year ago on revenue of $20.3 billion vs $18.3 billion last year. UPS is the world's largest parcel delivery company and on October 5th, Bloomberg reported that the Supreme Court denied an appeal from the Co, leaving it to award N.Y. state and city with $100 million won in a case regarding shipments of contraband cigarettes. From a technical point of view, the RSI is above its neutrality area at 50. The MACD is below its signal line and positive. The stock could retrace in the short term. Moreover, the stock is trading under its 20 day MA ($172) but above its 50 day MA ($165.03). We are looking at the final target of $183.30 with a stop-loss set at $167.20.
On Thursday, Amazon.com (AMZN) is likely to unveil third quarter EPS of $7.33 vs $4.23 last year on sales of $92.2 billion compared to 70.0 billion a year ago. The Co is the world's largest online retailer and web services provider, and on October 21st, the Co revealed that its prime members can now get free one-hour pick ups on orders at all Whole Foods stores in the United States. In other news, on October 16th, the Co announced that it plans to open two new fulfillment centers in Kansas in 2021, creating over 1,000 new jobs. From a chartist's point of view, the RSI is below its neutrality area at 50. The MACD is positive and below its signal line. The MACD must penetrate its zero line to expect further downside. Moreover, the share stands below its 20 and 50 day MA (respectively at $3,229.75 and $3,226.74). We are looking at the final target of $2,791.00 with a stop-loss set at $3,350.00.
On Friday, AbbVie (ABBV) is awaited to post third quarter EPS of $2.77 compared to $2.33 a year ago on revenue of $12.7 billion vs $8.5 billion last year. AbbVie is a biopharmaceutical company and on October 19th, the Co submitted applications to the U.S. Food and Drug Administration (FDA) and the European Medicines Agency (EMA) seeking approval for RINVOQ (upadacitinib) for the treatment of adolescents and adults with moderate to severe atopic dermatitis. Technically speaking, the RSI is below 50. The MACD is below its signal line and negative. The configuration is negative. Moreover, the share stands below its 20 and 50 day MA (respectively at $85.52 and $88.66). We are looking at the final target of $79.40 with a stop-loss set at $87.20.
Looking at the S&P 500 CFD on a 30 minute chart, the index has been falling in a short-term downtrend since price last peaked at 3,550.00 on October 12th. Price will likely continue its decline and fall to the first support level of 3,389.00. At 3,389.00 the index will probably find some support and bounce. After the bounce price will most likely fade and breakout to the downside of 3,389.00. If price breaks below 3,389.00 then its next target would be 3,356.00. If price breaks below 3,356.00 it would be a bearish signal that could send the index tumbling further. On the other hand, if the index finds strong support at 3,389.00 and manages to get above 3,440. it could retest the bearish trendline. If the index can manage to breakout to the upside of the bearish trendline it would be a bullish signal that could send price back up to 3,469.00 and higher.
Source: GAIN Capital, TradingView
Latest market news
April 25, 2024 03:09 PM
April 25, 2024 03:00 PM
April 25, 2024 01:12 PM
April 25, 2024 11:14 AM
Latest Equities articles

April 12, 2024 02:28 AM

April 7, 2024 08:46 PM

March 31, 2024 11:22 AM
