


The S&P 500 Appears To Be in a Short-Term Rectangle
On Tuesday, Adobe (ADBE) is awaited to post third quarter EPS of $2.41 compared to $2.05 a year ago on revenue of $3.2 billion vs $2.8 billion last year. The Co develops software products and on September 4th, Microsoft (MSFT) published a letter on their website stating that support for Adobe Flash Player will end after December 2020. From a technical point of view, the RSI is below 50. The MACD is below its signal line and positive. The MACD must penetrate its zero line to expect further downside. Moreover, the stock is below its 20 day MA ($487.63) but above its 50 day MA ($461.55). We are looking at the final target of $401.00 with a stop-loss set at $519.00.
Also on Tuesday, FedEx (FDX) is likely to unveil first quarter EPS of $2.58 vs $3.05 last year on revenue of $17.5 billion compared to $17.0 billion a year ago. The Co operates the largest express package delivery service in the world and on September 3rd, FedEx Logistics, a subsidiary of the Co, announced the opening of another Foreign Trade Zone (FTZ) in El Paso, Texas. In other news, also on September 4th, Bloomberg reported that the Co expects to hire roughly 70,000 workers for the holiday season surge. From a chartist's point of view, the RSI is above 70. It could mean either that the stock is in a lasting uptrend or just overbought and therefore bound to correct (look for bearish divergence in this case). The MACD is below its signal line and positive. The stock could retrace in the short term. Moreover, the stock is trading above both its 20 and 50 day MA (respectively at $217.43 and $188.58). We are looking at the final target of $259.80 with a stop-loss set at $214.40.
Last week, Apple (AAPL), the consumer electronics company, had a large amount of news volume on the topic of price loss. During last weeks trading the Co fell 7.41%. On Tuesday, September 8th, Bloomberg reported that the Co will begin production of its 5G iPhones on a limited scale in mid-September, shrinking the delay to weeks from the originally estimated months. Looking at a daily chart, the RSI is bearish and calls for further downside. We are looking at the final target of $100.00 with a stop-loss set at $120.00.
Additionally last week, Tesla (TSLA), the electric-vehicle maker, had the most publications on the US stock market on the topic of price gain, even though last week the Co dropped 10.9%. On Friday, September 11th, Bloomberg disclosed that the Co plans to ship its China-built cars to other markets in Asia and Europe. Technically speaking, the RSI is below 50. The MACD is positive and below its signal line. The MACD must penetrate its zero line to expect further downside. Moreover, the stock is below its 20 day MA ($403.54) but above its 50 day MA ($338.9). We are looking at the final target of $244.00 with a stop-loss set at $437.00.
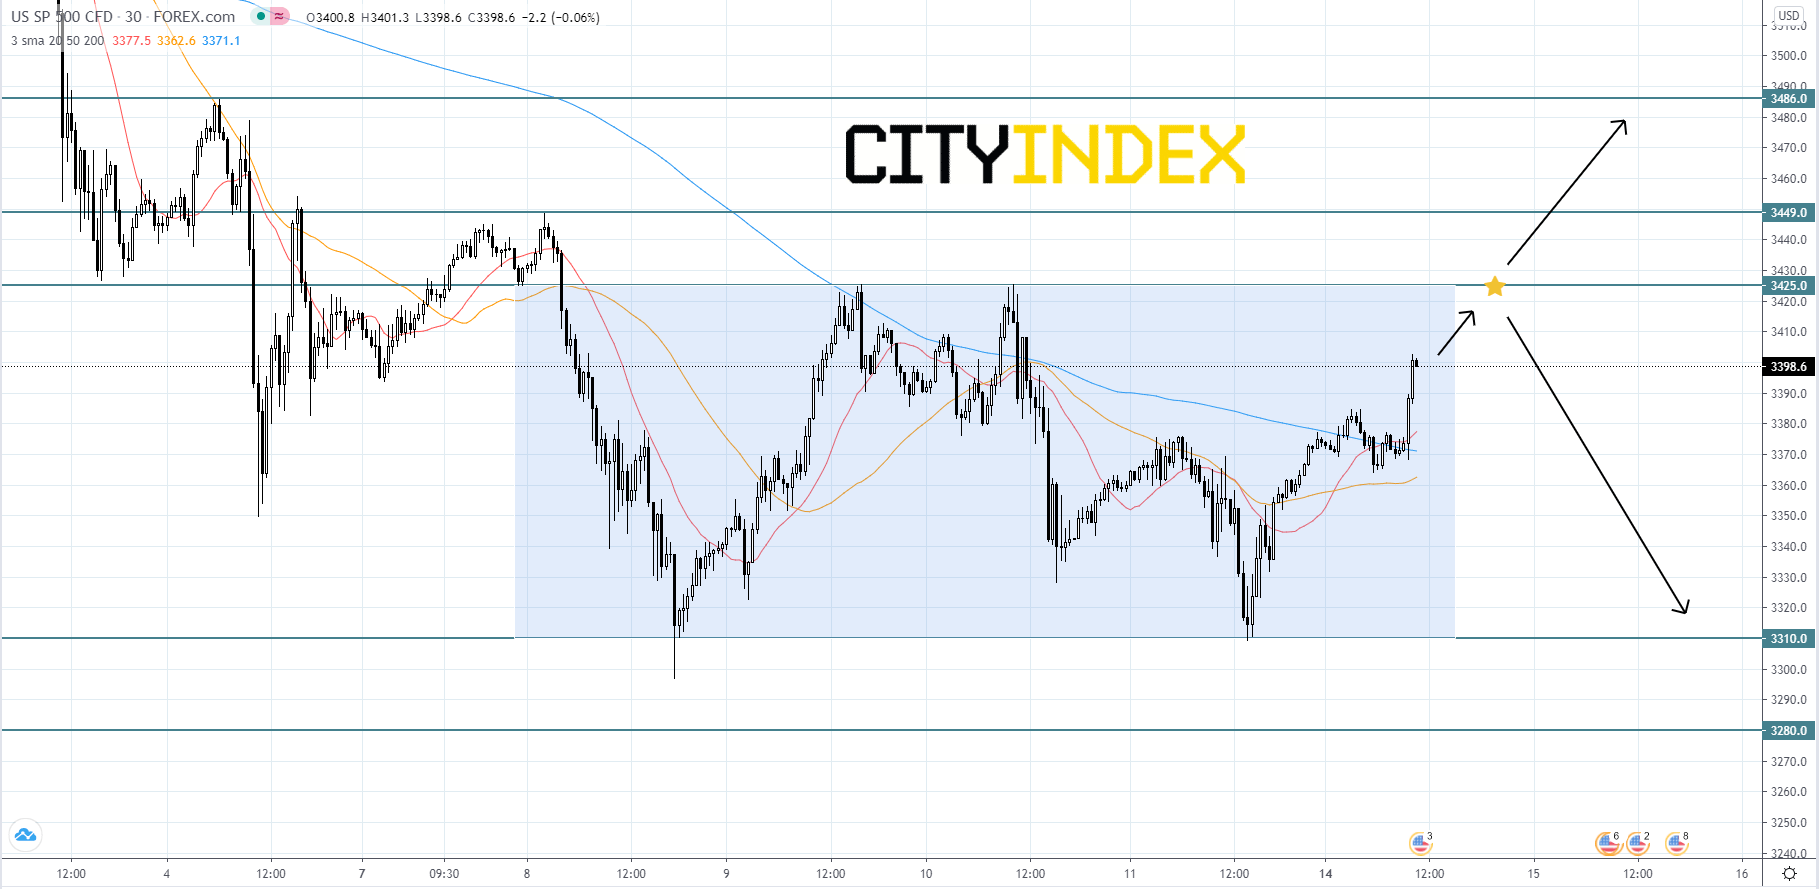
Looking at the S&P 500 CFD on a 30 minute chart, the index appears to be trading within a short-term sideways trend, also known as a rectangle, that began to form last week. Price will likely continue to rise until it reaches the upper boundary of the rectangle at 3425.00. If price is rejected at the 3425.00 resistance level, then the index will probably have a choppy journey back down to the 3310.00 support level. If price breaks out thorough the lower boundary of the rectangle at 3310.00, price could drop further to its second support level of 3280.00, which would be a bearish signal. On the other hand, if price breaks out above the 3425.00 resistance level, price could accelerate to 3449.00 and even 3486.00 in an attempt to continue to the long-term uptrend. Regardless of which way price breaks out, it will likely continue in that direction afterwards.
Source: GAIN Capital, TradingView
Also on Tuesday, FedEx (FDX) is likely to unveil first quarter EPS of $2.58 vs $3.05 last year on revenue of $17.5 billion compared to $17.0 billion a year ago. The Co operates the largest express package delivery service in the world and on September 3rd, FedEx Logistics, a subsidiary of the Co, announced the opening of another Foreign Trade Zone (FTZ) in El Paso, Texas. In other news, also on September 4th, Bloomberg reported that the Co expects to hire roughly 70,000 workers for the holiday season surge. From a chartist's point of view, the RSI is above 70. It could mean either that the stock is in a lasting uptrend or just overbought and therefore bound to correct (look for bearish divergence in this case). The MACD is below its signal line and positive. The stock could retrace in the short term. Moreover, the stock is trading above both its 20 and 50 day MA (respectively at $217.43 and $188.58). We are looking at the final target of $259.80 with a stop-loss set at $214.40.
Last week, Apple (AAPL), the consumer electronics company, had a large amount of news volume on the topic of price loss. During last weeks trading the Co fell 7.41%. On Tuesday, September 8th, Bloomberg reported that the Co will begin production of its 5G iPhones on a limited scale in mid-September, shrinking the delay to weeks from the originally estimated months. Looking at a daily chart, the RSI is bearish and calls for further downside. We are looking at the final target of $100.00 with a stop-loss set at $120.00.
Additionally last week, Tesla (TSLA), the electric-vehicle maker, had the most publications on the US stock market on the topic of price gain, even though last week the Co dropped 10.9%. On Friday, September 11th, Bloomberg disclosed that the Co plans to ship its China-built cars to other markets in Asia and Europe. Technically speaking, the RSI is below 50. The MACD is positive and below its signal line. The MACD must penetrate its zero line to expect further downside. Moreover, the stock is below its 20 day MA ($403.54) but above its 50 day MA ($338.9). We are looking at the final target of $244.00 with a stop-loss set at $437.00.
Looking at the S&P 500 CFD on a 30 minute chart, the index appears to be trading within a short-term sideways trend, also known as a rectangle, that began to form last week. Price will likely continue to rise until it reaches the upper boundary of the rectangle at 3425.00. If price is rejected at the 3425.00 resistance level, then the index will probably have a choppy journey back down to the 3310.00 support level. If price breaks out thorough the lower boundary of the rectangle at 3310.00, price could drop further to its second support level of 3280.00, which would be a bearish signal. On the other hand, if price breaks out above the 3425.00 resistance level, price could accelerate to 3449.00 and even 3486.00 in an attempt to continue to the long-term uptrend. Regardless of which way price breaks out, it will likely continue in that direction afterwards.
Source: GAIN Capital, TradingView
Latest market news
Yesterday 01:23 PM
Yesterday 06:01 AM
April 18, 2024 11:27 PM
Latest Equities articles
April 12, 2024 02:28 AM
April 7, 2024 08:46 PM
March 31, 2024 11:22 AM
