


As long as 1480 holds as resistance and trade headlines remain favourable, the path of least resistance points lower for gold.
Yesterday we noted that yen pairs were testing key support levels whilst the elusive ‘phase one’ trade deal sat on a knife’s edge. Well it was no surprise to see gold (a safe-haven during times of turmoil) probing resistance, as a break lower on JPY pairs would have assumed a break higher on gold prices. Yet with developing headlines favouring a mild risk-on appetite later in the sessions, JPY held above support and gold turned lower from resistance.
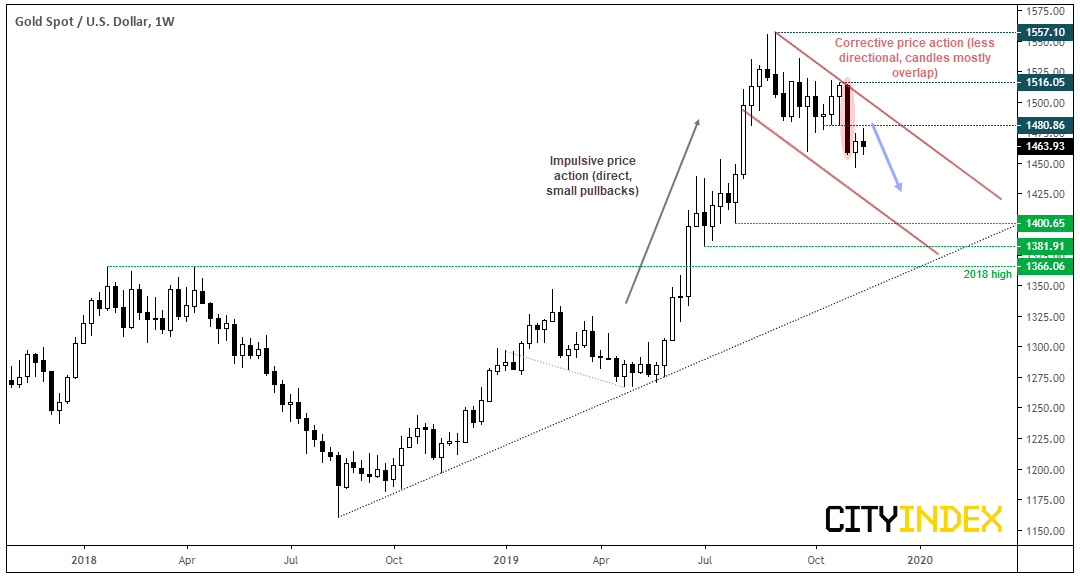
Due to price action behaviour since the 1557, gold appears to remain in a correction from its highs and could print new lows. Moreover, it remains overextended from its bullish trendline and the elongated bearish candle two weeks ago shows bears are in control overall.
If the US-China headlines remain skewed to the upside, it could continue to weigh on gold and force prices lower. Over the near-term, 1480 needs to cap as resistance for the bearish bias to play out. On the weekly chart, prices continue to look extended from its July trendline despite suffering its worst weekly close in 3 years. And it appears gold is to close the week with another doji below resistance.
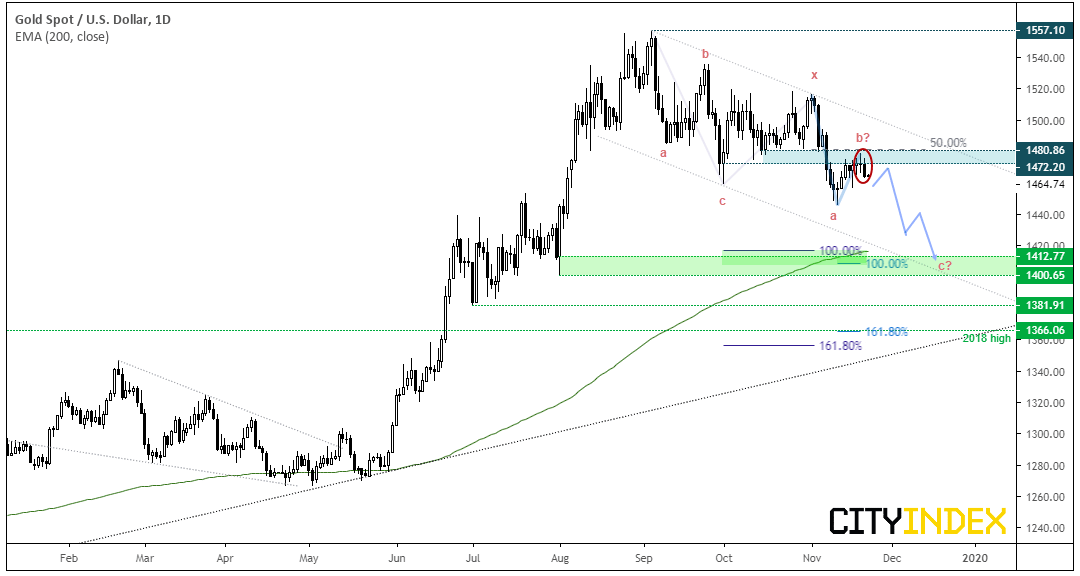
Since prior analysis, gold made a minor new low before gently retracing towards the 1480 area. It remains in a bearish channel which could allow for further upside before turning notably lower, yet there’s a decent zone of resistance around 1472-1480 which is currently capping any upside. For now, it looks like resistance could hold around the 50% retracement level. Also notice that prices have failed multiple times to close above 1472.20, which is the close low on the 31st of October.
Momentum is beginning to turn lower once more. Yesterday’s bearish engulfing candle closed at a 6-day low and confirmed the series of hammers and doji’s as near-term tops. So long as 1480 holds as resistance, we could be in the final C-wave of a double zig-zag correction from the 1557 high, which projects an approximate target around 1412.
- Near-term bias remains bearish below 1480.
- Bears could target 1420, which is just above two 100% Fibonacci projections and near the 200-day eMA. Interestingly, two 161.38% bearish projections also stall in the same area around 1366 and near the bullish trendline, making it an area to consider for a lower target if bearish momentum persists.
- At this stage, a break above 1480 simply suggests wave b is to be a little deeper. We would then look for the bearish channel to hold as resistance before its next leg lower.
Related Analysis:
Yen Pairs Test Key Support Whilst ‘Phase One’ Sits On A Knife's Edge
Gold’s Worst Week in 3 Years Sees Bears Firmly Back In Control
Latest market news
Today 11:14 AM
Today 08:28 AM
Yesterday 03:30 PM
Latest Commodities articles
April 22, 2024 03:42 AM
April 19, 2024 03:35 AM
April 17, 2024 03:02 AM
April 15, 2024 12:48 AM