


The one variable that explains this week’s big market moves…and what it means for CAD/JPY
For a generally quiet post-holiday, pre-earnings week, we’ve certainly seen some big market moves so far:
- The Global Dow, an equally-weighted basket of the top 150 companies in the world, is in the midst of its 3rd-worst weekly drop this year.
- WTI crude oil is trading down -4.3% week-to-date as of writing, the 2nd-biggest weekly selloff of the year so far.
- Most importantly, the benchmark US 10-year treasury bond is trading down -19bps this week, already the biggest down week in over a year.
So what’s driving these big moves?
To boil it down to one factor: Positioning.
Over the last several months, many markets have become one-way trades, attracting trend-following speculators and leading to excessive positioning in several of the planet’s most-traded assets. Essentially, when “everyone” has bought into an established trend, there are relatively few traders left to join the trend and drive it further along, making the trending market vulnerable to a violent reversal, even if there’s no new market-moving news.
For example, according to the most recent Commitment of Trader report from the CFTC, futures traders were holding their largest net long position in the S&P 500 in over a year and a nearly 18-month record net short position in 10-year US treasury bonds heading into this week. These positioning extremes no doubt contributed to the violent reversals were seeing in the stock and bond markets.
What about the FX market?
Monitoring trader positioning is especially important in the FX market, where traders are, by definition, are entering a pairs trade and can look to combine one currency with an extreme net short position against a different currency with a large net long position, giving themselves two chances to be “right” on a single trade.
Enter CAD/JPY
While not among the most-traded of the major crosses, CAD/JPY provides a perfect example of this dynamic in action. Last week’s COT report showed a 2-year high in speculative net short positions on the yen and a 3.5-year high in speculative net long positions in the loonie. Combined with a big drop in the price of oil, Canada’s most important export, and general risk-off sentiment driving demand for the yen, CAD/JPY has seen a big drop so far this week.
Looking at the chart, CAD/JPY has sliced through previous-resistance-turned-support at 88.30, as well as breaking below its 100-day exponential moving average for the first time this year. This breakdown was preceded by an extended bearish divergence in the 14-day RSI indicator, signaling that buying pressure had already been fading over the last couple of months. Despite the big selloff so far this week, the RSI is still not in oversold territory, suggesting that rates may have further to fall before seeing a meaningful short-term bounce:
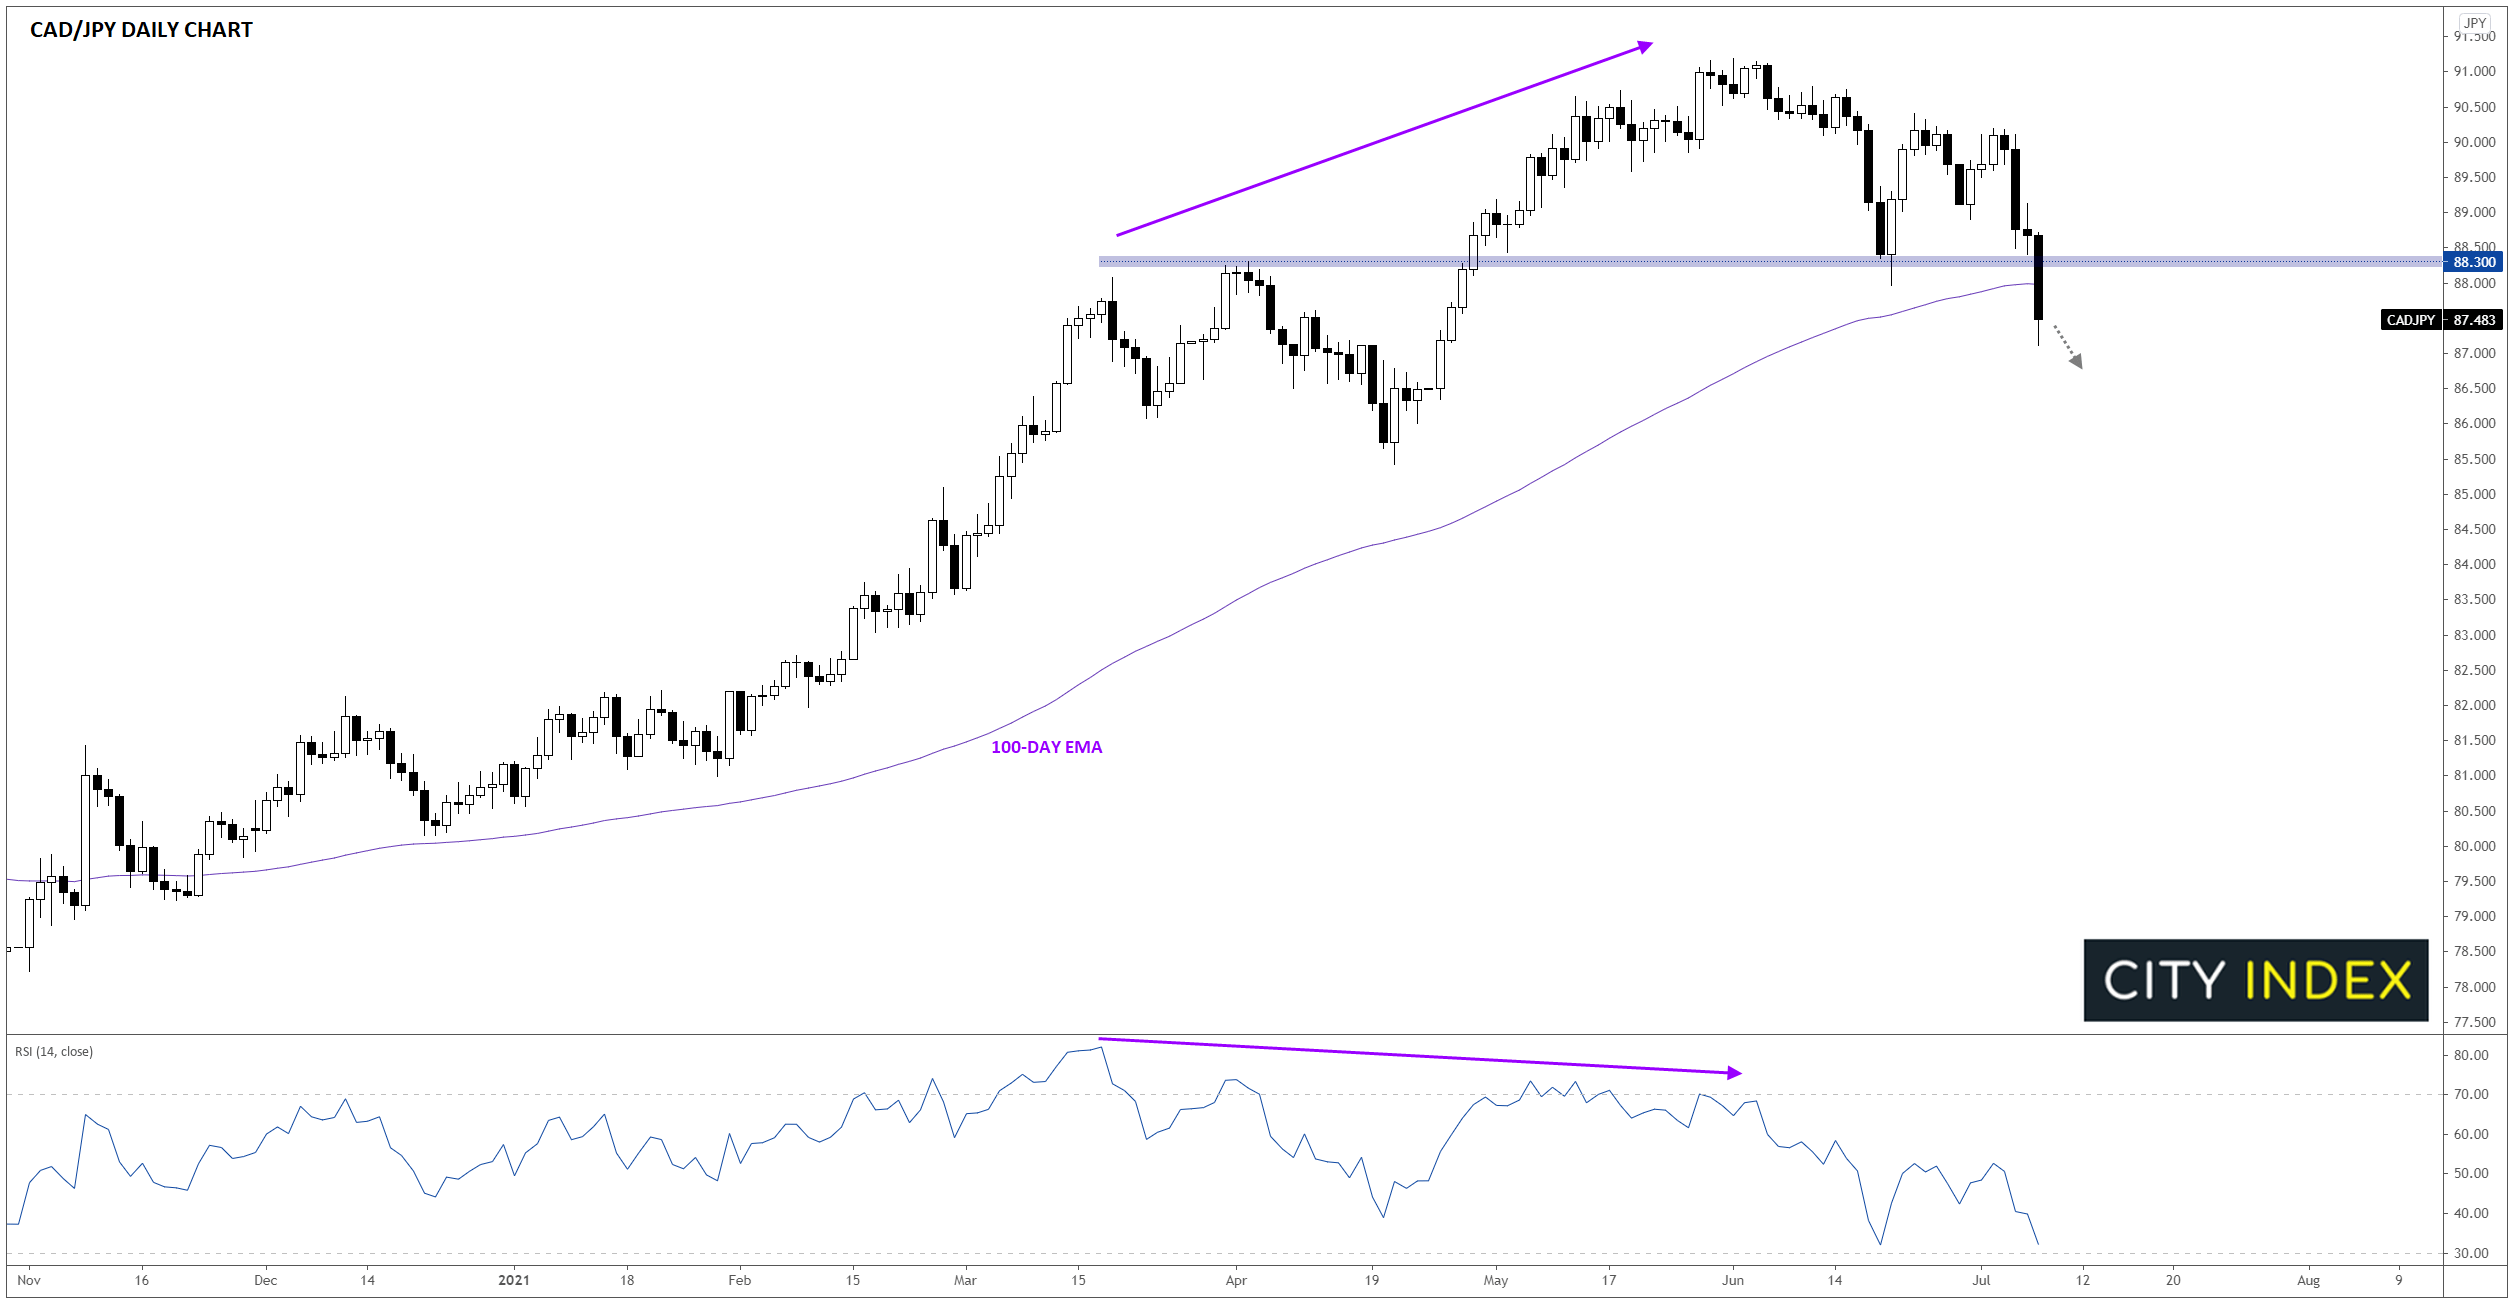
Source: StoneX, TradingView
Taking a step back, these positioning extremes built up over the course of months, so it could still take weeks for CAD/JPY traders to unwind their positions and the market to return to a more balanced state. As long as CAD/JPY holds below the key 88.30 level, bears will maintain the upper hand and could look to drive the unit into the mid-80s as we move through July.
How to trade with City Index
Follow these easy steps to start trading with City Index today:
- Open a City Index account, or log-in if you’re already a customer.
- Search for the market you want to trade in our award-winning platform.
- Choose your position and size, and your stop and limit levels.
- Place the trade.
Latest market news
Today 01:15 PM
Latest CAD articles
March 23, 2023 07:33 PM
March 13, 2023 02:54 PM
February 21, 2023 02:21 PM
February 17, 2023 04:05 PM