


March 24, 2020 4:52 PM
The Collapse of the Mexican Peso
In what feels like years ago, on February 27th, we wrote about the fall of the Mexican Peso. Fundamentally, we discussed how USD/MXN was heading higher as the carry trade was being unwound. As stocks moved lower, traders had to sell pesos and buy back US Dollar and Euros. As a result, both USD/MXN and EUR/MXN both were moving higher. Technically, price of USD/MXN had broken out of 2 channels, back inside a long-term triangle, and had stalled near the 61.8% Fibonacci retracement level from the August 29th, 2019 highs to the February 17th lows. The RSI was overbought, but we discussed how it could become “more overbought”. This is how the chart looked on February 27th:
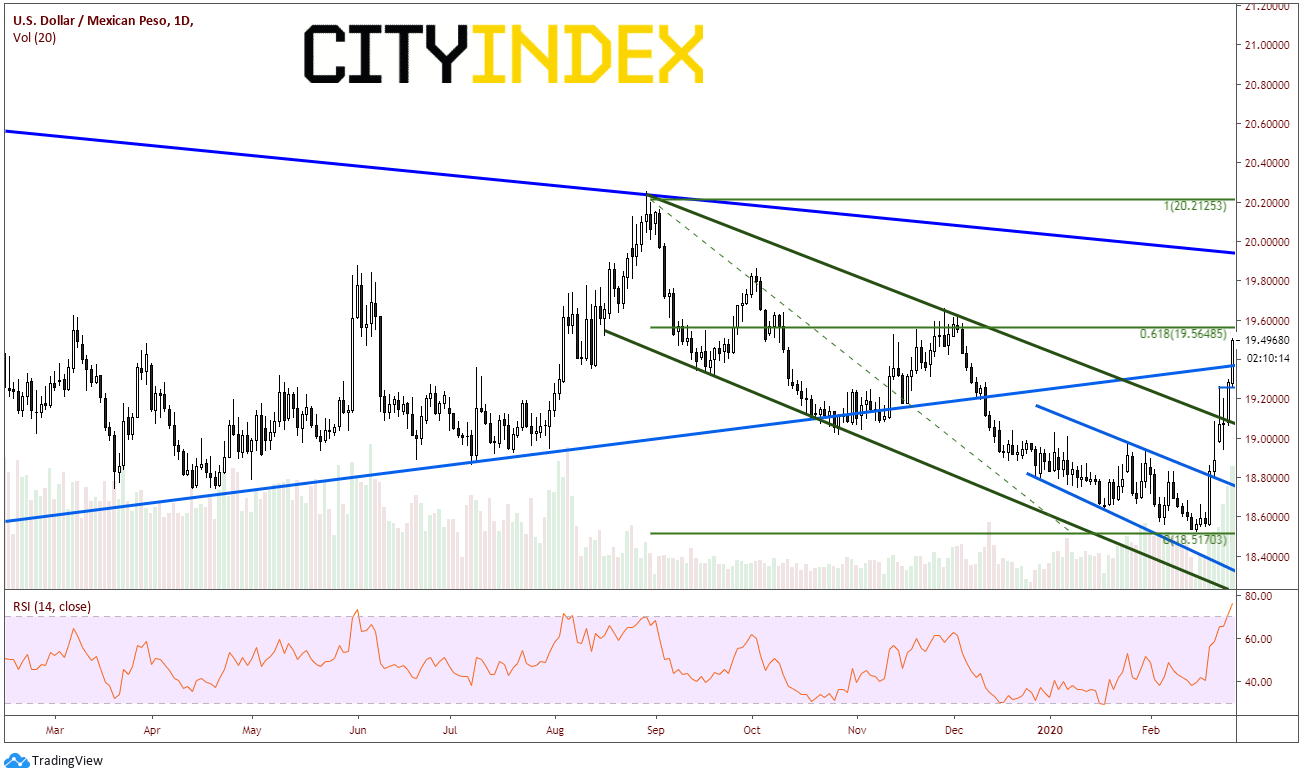
Source: Tradingview, City Index
As the selloff continued in global stock markets throughout the month of March, Emerging Market currencies, in general, continued to move lower vs the USD. In particular, the USD/MXN shot higher as demand for US Dollars increased significantly. Although the US Fed flooded the markets with US Dollars and created additional swap lines to provide US dollar liquidity to Mexico, the fear of uncertainty surrounding the coronavirus and the US economy caused traders to flee Mexican pesos. In addition, the Central Bank of Mexico held an emergency meeting of its own on March 20th and cut the benchmark by 50bps to 6.5%. This past weekend, President Trump also closed the US-Mexico border.
Below is an updated chart of the USD/MXN. As stocks moved lower, the emerging market pair continued to move higher. On March 3rd , price put in a low of 19.1509 and it was off to the races. Since then, USD/MXN has rallied almost 33% to an all-time high today of 25.4474, however has since pulled back slightly to 24.9228 as stock markets rallied today. Notice how RSI did pull back for a short amount of time into the neutral area but reached a high yesterday of 95.97.
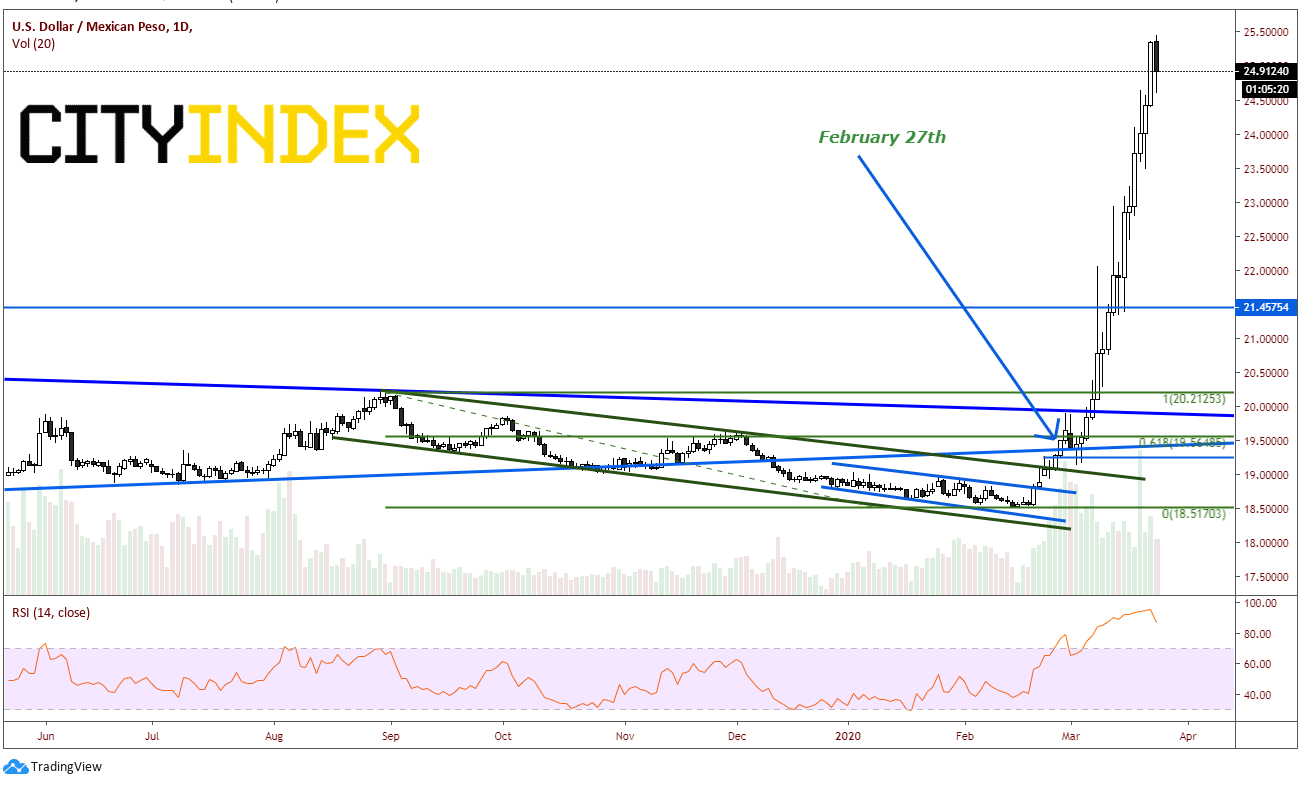
Source: Tradingview, City Index
Initial horizontal support comes in 24.9557. If today’s high is to be the high for a while, we can begin to look for Fibonacci levels below for more support. The 38.2% Fibonacci retracement level comes in near 23.0410, which is also close to horizontal support. Below that is the 50% retracement level at 22.2919. Initial resistance is at today’s highs near 25.4447. Today’s high also happens to be the 161.8% extension from the highs on March 19th to the lows on February 20th. Above that is the target for a small flag pattern that has formed over the last few days near 26.65.
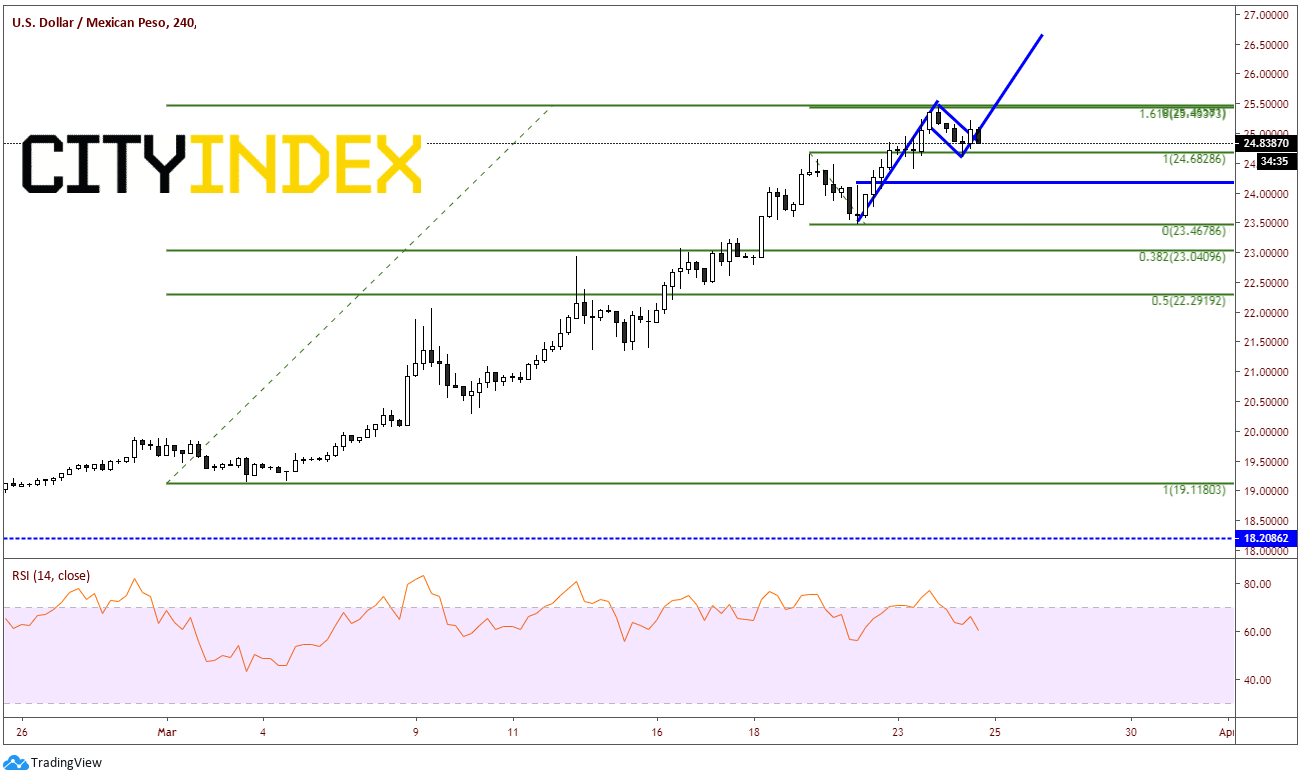
Source: Tradingview, City Index
Latest market news
Yesterday 01:23 PM
Yesterday 06:01 AM
April 18, 2024 11:27 PM
Latest Forex articles
Yesterday 06:01 AM
April 17, 2024 02:40 PM
April 17, 2024 04:47 AM