


September 27, 2021 5:15 PM
The NASDAQ 100 is down roughly 0.9% today, yet one of its most popularly traded companies is up over 2.2%! Over the weekend, Tesla’s famed founder, Elon Musk, sent an email to employees in which he declared, “This will be Tesla’s most intense delivery week ever!” Talk about a way to pump up your employees! It’s no surprise that Musk is looking to have a big push into the end of quarter. Since Tesla owns all their cars until they are sold (direct supply chain), of course they would want to sell as many as possible before the quarter ends. So as the NASDAQ 100 struggles to turn positive on the day, TSLA is up 2.% (to the moon?).
A history of Tesla year by year
On a daily timeframe, TSLA reached a high of 900.40 on January 25th and pulled back 40% to 539.49 by March 5th! After a volatile bounce into resistance at 780.70 on April 14th, the stock pullback and retested the 538.49 level on May 19th. Since then, TSLA’s stock price has been grinding higher in an orderly channel, while riding just above the 50- and 200-Day Moving Averages. After the Elon’s email over the weekend, price finally pushed back about the 780.70 level and is currently testing the upward sloping top trendline of the channel.
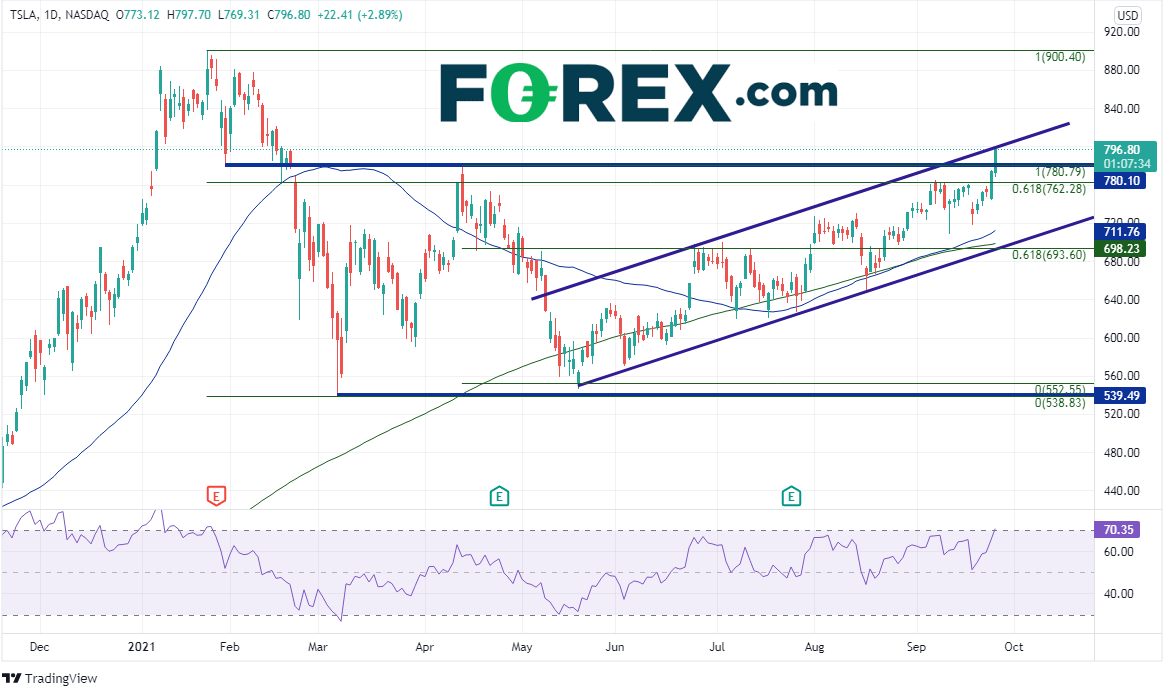
Source: Tradingview, Stone X
Trade TSLA now: Login or open a new account!
On a 240-minute timeframe, if the price of TSLA’s stock is able to break above the trendline and psychological round number resistance at 800, the 127.2% Fibonacci extension from the April 14th highs to the May 18th lows at 844.48 is the next resistance level, ahead of the all-time highs at 900.40. However, if price can’t push through resistance, the 50-Day Moving Average acts as first support at 780.71 and then the September 13th lows at 709.16. The bottom trendline of the upward sloping channel is at 694.41. Notice that the RSI is in overbought territory, an indication that TSLA’s stick price may be ready for a pullback.
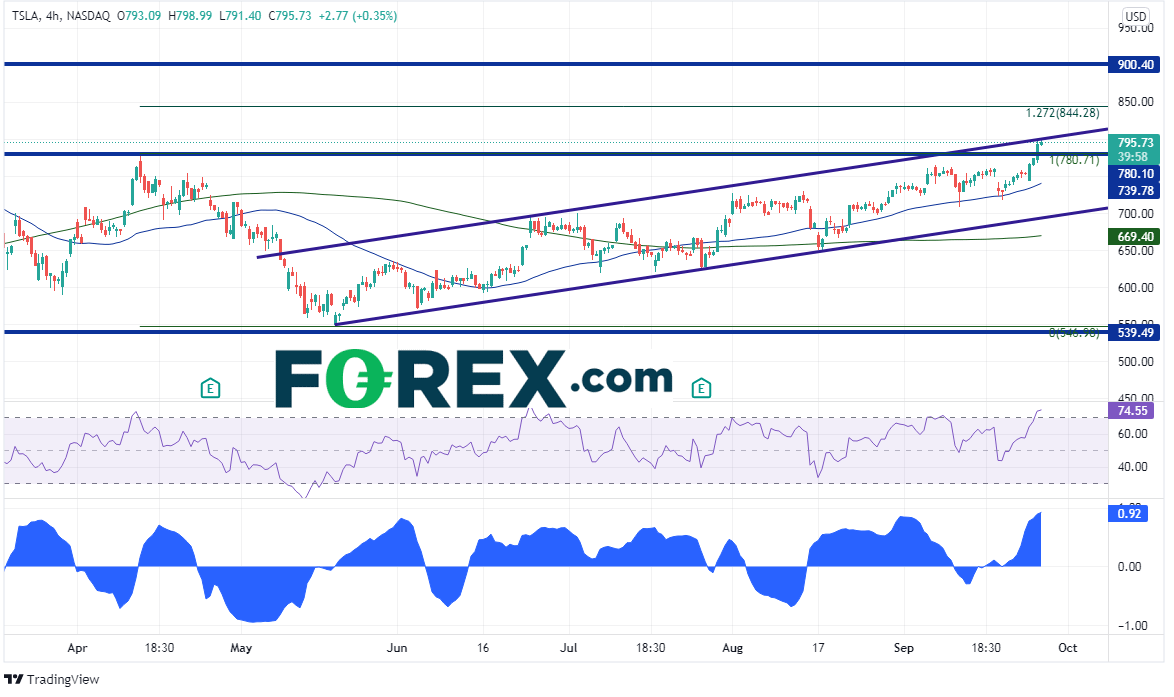
Source: Tradingview, Stone X
At the very bottom of the screen is the correlation coefficient between TSLA and WTI Crude Oil. There have a lot of strong correlation’s lately, and this is another good one. (See USD/JPY and 10 year yeilds). On the 240-minute timeframe, the correlation coefficient between these two assets is +0.92. We look for readings about +0.80 or below -0.80 to indicate a strong correlation. A reading of +1.00 means there is a perfect positive correlation and the 2 assets will always move together in the same direction. A reading of +0.92 is pretty close! Watch the price of crude oil in the shorter-term to help gauge a direction for TSLA. (This makes sense conceptually as well. Higher prices of oil will lead people to search for alternatives to gas powered car, such as electric cars. Thus, there will be more demand Telsas and TSLA will move higher!)
Learn more about equity trading opportunities.
Latest market news
Today 05:45 AM
Yesterday 11:09 PM
Yesterday 11:01 PM
Yesterday 04:00 PM
Yesterday 01:15 PM
Latest Equities articles
April 12, 2024 02:28 AM
April 7, 2024 08:46 PM
March 31, 2024 11:22 AM
