


Tesla (TSLA) joins the S&P 500 after a record day, pullback potential
This week marks the first time Tesla Motors (TSLA) has officially been included in the widely-followed S&P 500 index, and based on its price action so far today, index investors are probably disappointed with their new holding.
After hemming and hawing for months, the S&P 500 committee finally agreed to add TSLA to the index last month, with the stock joining the index at a weighting of 1.6%, behind only the major FAAMG stocks (Facebook, Apple, Amazon, Microsoft, and Google (Alphabet). As of writing, the stock is trading down by nearly -6% on the day, subtracting nearly -0.1% from the performance of the S&P 500 as a whole.
So what can traders expect from TSLA moving forward?
Clearly, the company’s addition to the S&P 500 has already priced in, with shares rising fully 60% since the decision was made a little more than a month ago. In a potential last-ditch effort to “frontrun” the inclusion, Tesla’s stock set an all-time record for single-day equity trading volume at $148B on Friday, with more volume in TSLA than in the next 25 most actively traded stocks combined:
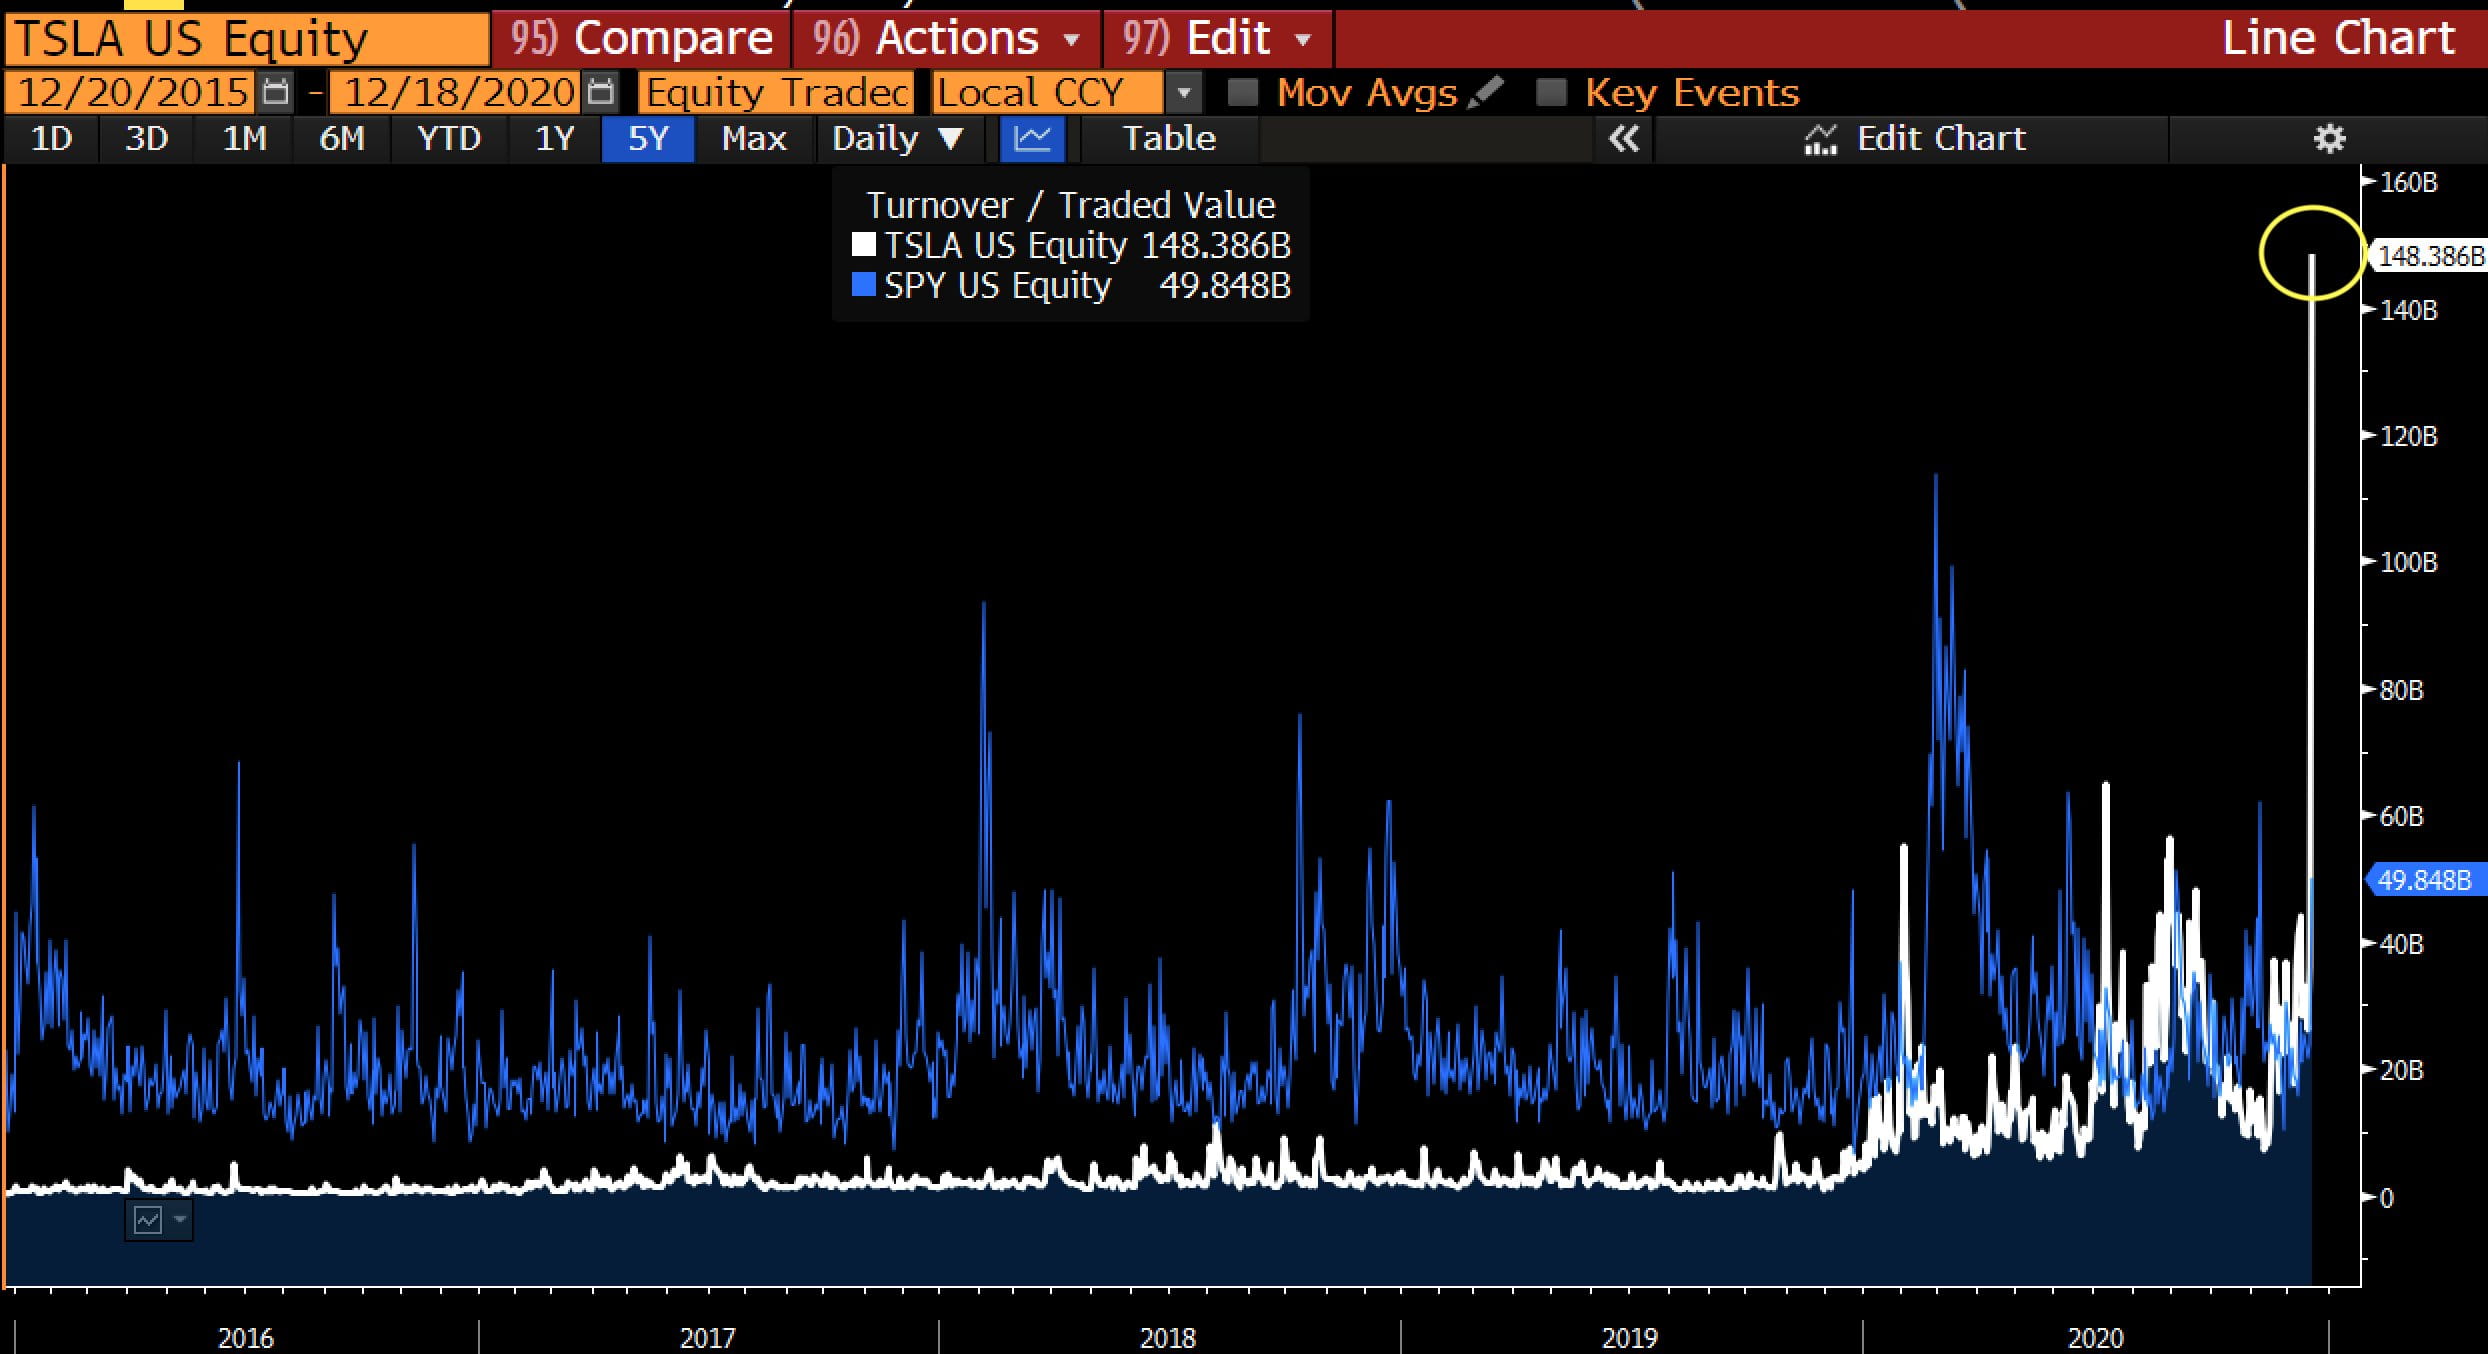
Source: Bloomberg
In other words, TSLA is the premier stock for active traders at the moment.
While we’re hesitant to apply historical benchmarks to a stock in the throes of an unprecedented rally, it is worth noting that generally speaking, shares of companies added to major indices tend to rally in advance of the inclusion day before going on to underperform the broader index over the next week or two. As an example, the chart below shows the average performance of 61 stocks added to the S&P 500 from 2014-2016, showing that they tended to rally in the week before inclusion and reverse those gains once they were included in the index:
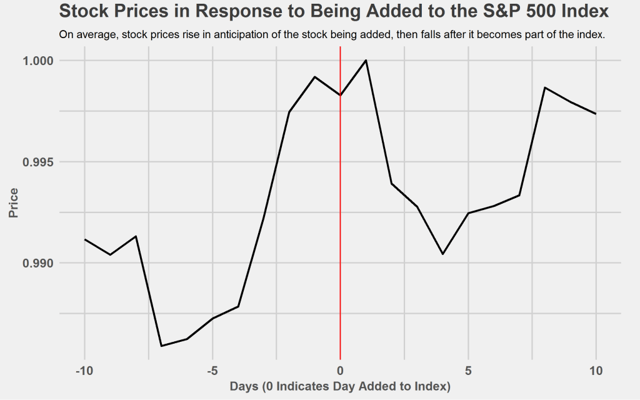
Source: Signal Plot
At the moment, TSLA is a one way freight train motoring north, but there are some signs that the rally may be getting stretched. For instance, the pair is currently showing a triple “bearish divergence” with its daily RSI indicator, showing less buying pressure on each subsequent high over the last month. Meanwhile, the stock had surged $170 above its own 50-day EMA as of Friday, which mirrors the previous record gap from late August that led to a 10-week consolidation before the latest upleg.
With historical tendencies and the technical indicators hinting at a potential pullback or consolidation in TSLA, bullish traders may want to consider tightening stop losses, while nimble bears could look for price to break below Friday’s low to signal a possible deeper retracement back below $600 heading into the end of the year.
Learn more about equity trading opportunities.
Latest market news
Yesterday 03:00 PM
Yesterday 01:12 PM
Yesterday 11:14 AM
Yesterday 08:28 AM
April 24, 2024 03:30 PM
Latest Tech Stocks articles
October 19, 2023 09:47 AM
October 18, 2023 12:06 PM
October 11, 2023 02:41 PM
October 3, 2023 12:24 PM