


Medium-term technical outlook on Hong Kong 50/Hang Seng Index

click to enlarge charts
Key Levels (1 to 3 weeks)
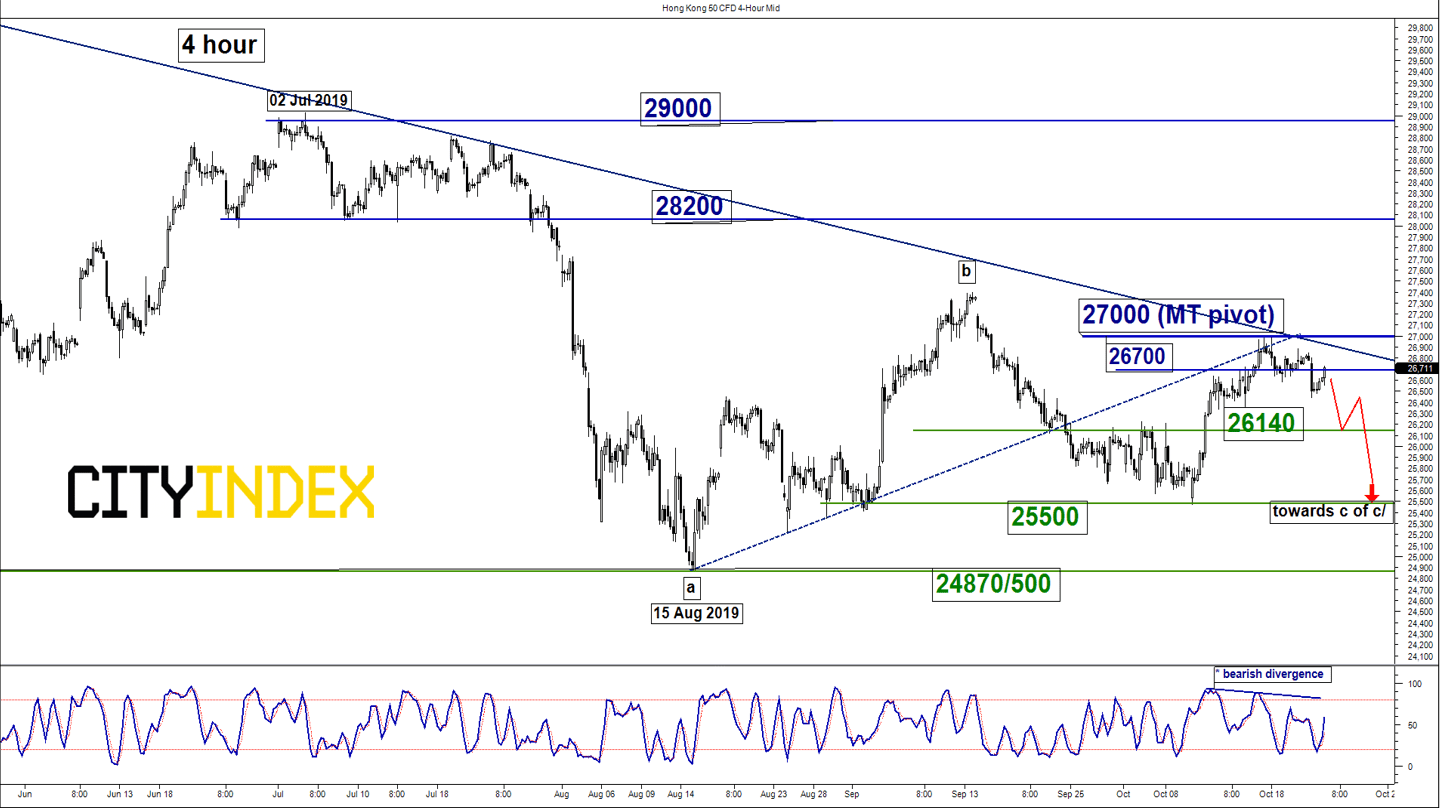
Intermediate resistance: 26700
Pivot (key resistance): 27000
Supports: 26140, 25500 & 24870/500
Next resistance: 28200
Directional Bias (1 to 3 weeks)
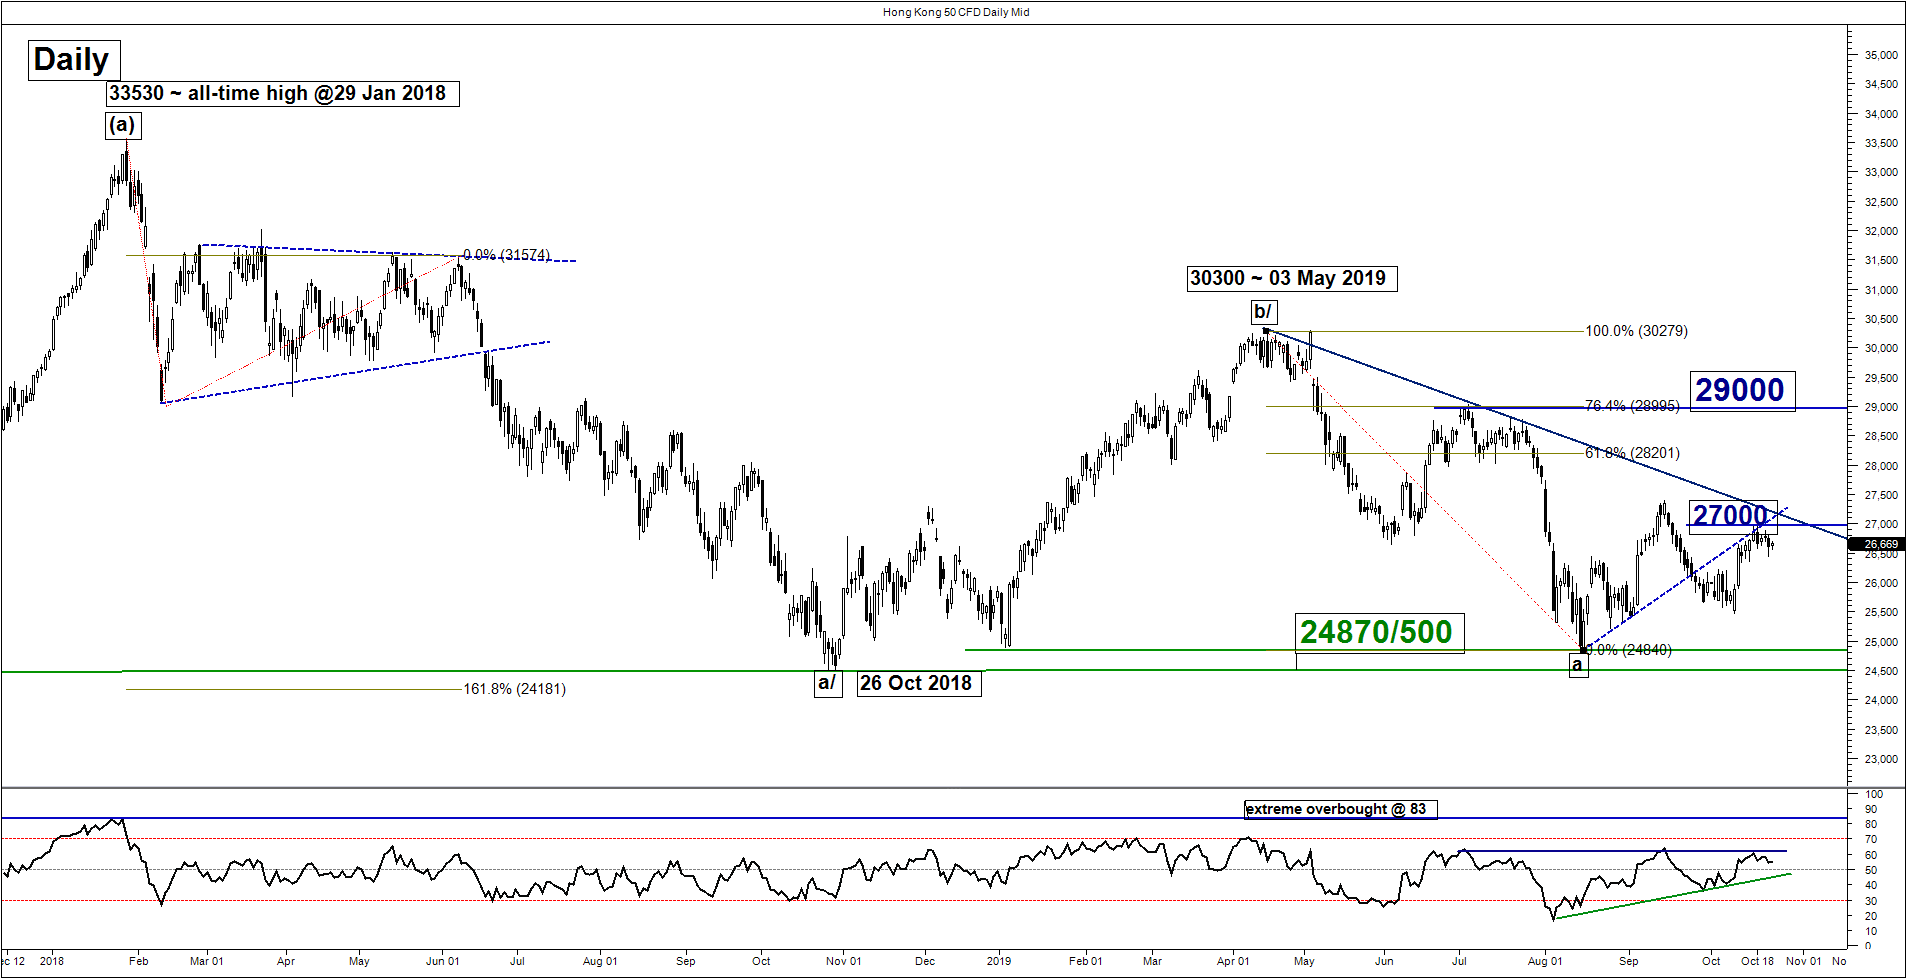
Bearish bias below 27000 pivotal resistance for potential push down towards 26140 before targeting the next support at 25500 within a major range consolidation configuration in place since 26 Oct 2018 low seen in the Hong Kong 50 Index (proxy for Hang Seng Index futures).
However, a clearance with a daily close above 27000 invalidates the bearish scenario for a further corrective rebound towards the upper limit of the major range configuration; setting sight on 28200 in the first step (former swing low areas of 26 Jun/09 July 2019 & the 61.8% Fibonacci retracement of the previous decline from 03 May high to 15 Aug 2019 low).
Key elements
- The recent rebound from 10 Oct 2019 low of 25475 has stalled at a medium-term descending trendline from 03 May 2019 high, acting as a resistance at 27000 that confluences with the 76.4% Fibonacci retracement of the recent slide from 13 Sep high to 10 Oct 2019 low and the former ascending support from 15 Aug 2019 low.
- The 4-hour Stochastic oscillator has traced out a bearish divergence signal at its overbought region which indicates that the upside momentum of the recent rebound from 10 Oct low to 18 Oct 2019 high has started to wane. Thus, the risk of a short to medium-term downside reversal increases at this juncture.
- Negative elements have been sighted in the heavy weightage component stocks of the Hang Seng Index; Tencent (Technology) and AIA (Financials) with a combined weightage of 19.48% that may put a downside pressure in the Hang Seng Index (see below charts for more details).

click to enlarge chart
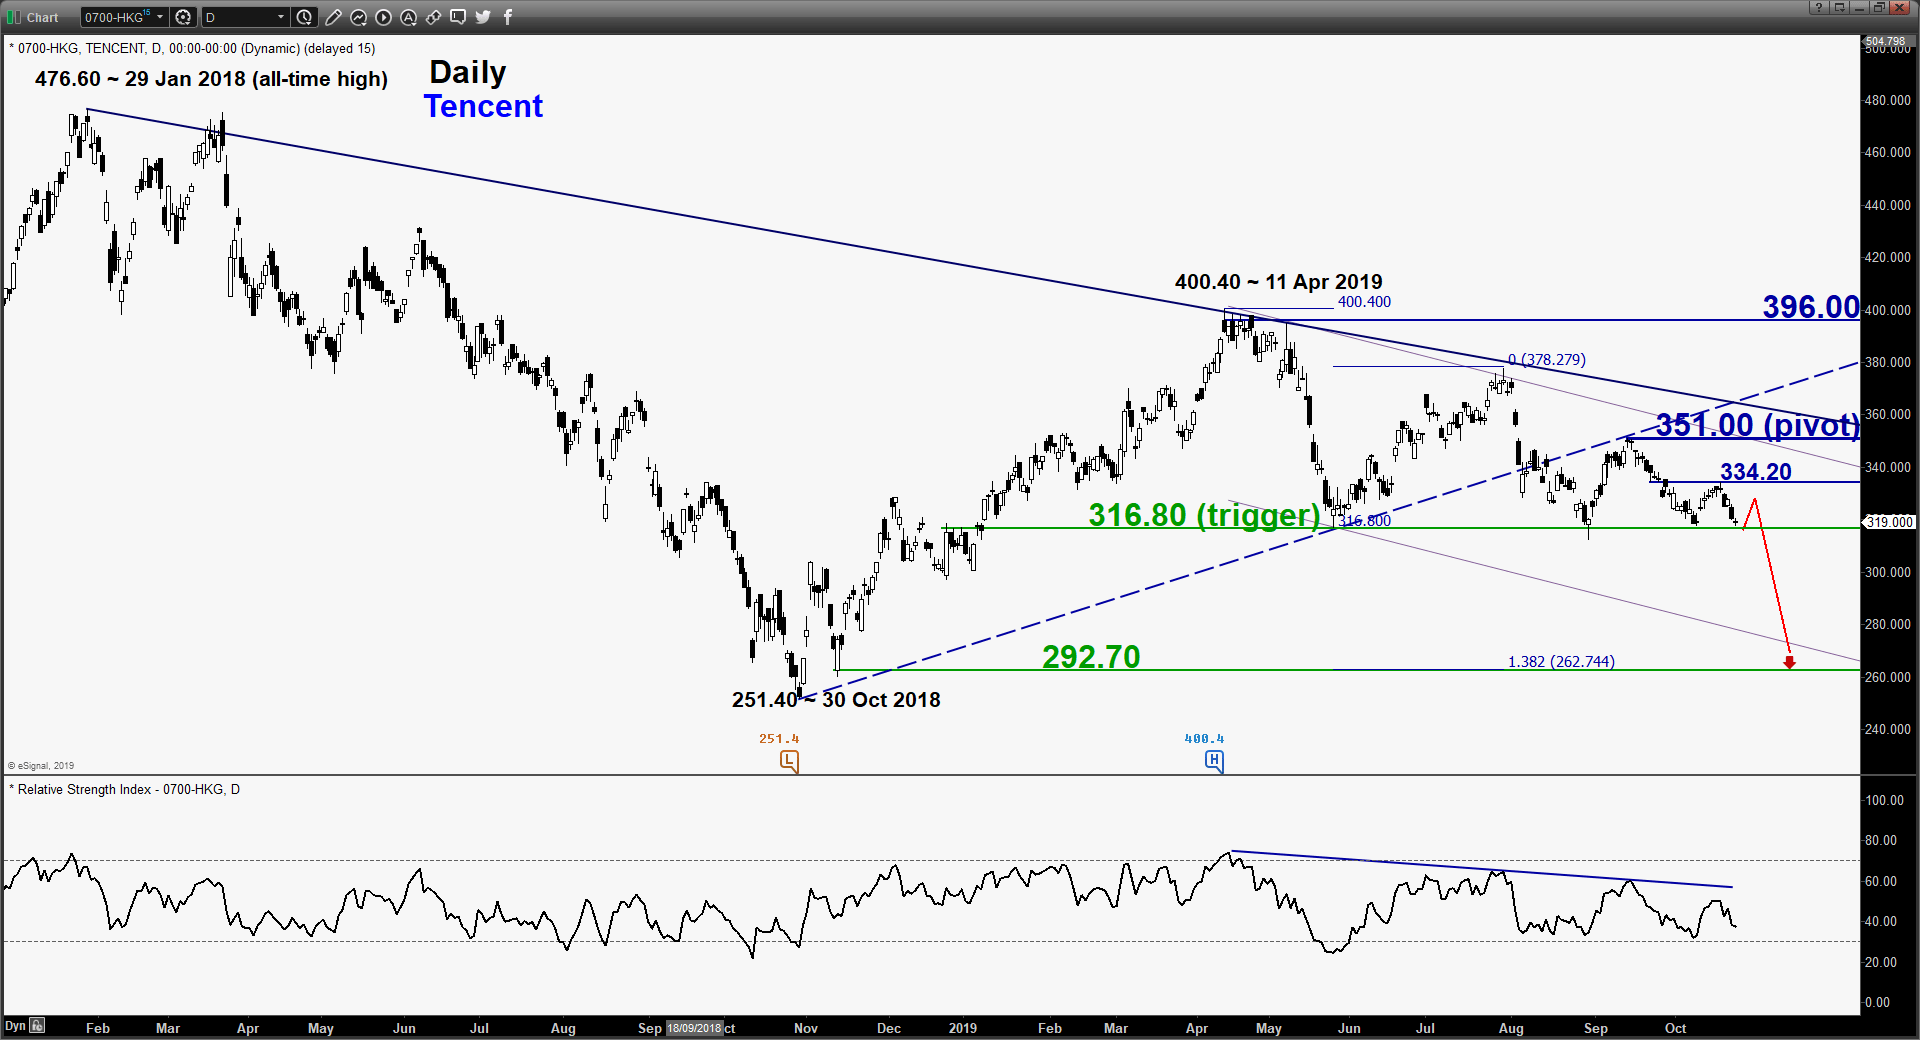
- Highlighted in our previous report (click here for a recap); 351.00 key pivotal support and 316.80 remains the significant downside trigger level (a range support in place since 21 Dec 2018).
- A break below 316.80 opens up scope for a potential multi-week decline towards the 30 Oct 2018 swing low area at 292.70.
click to enlarge chart
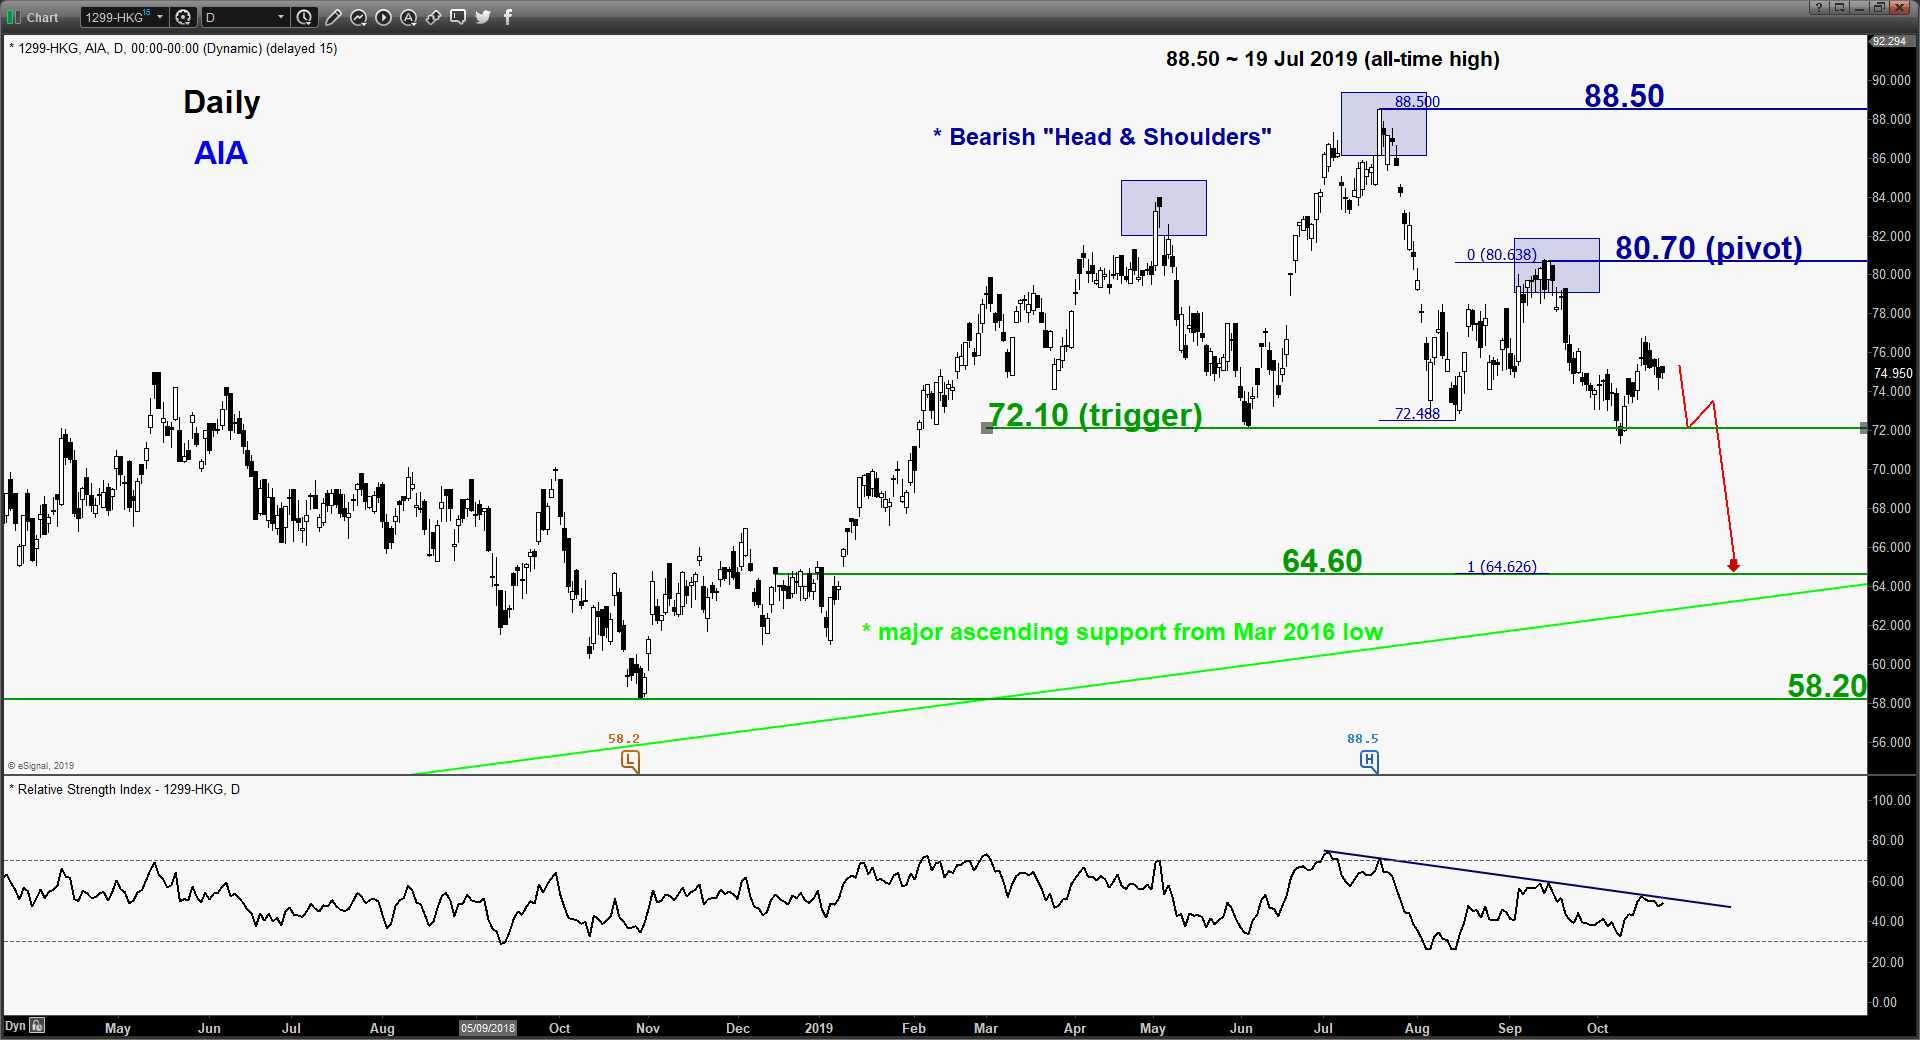
- Since 88.50 all-time high printed on 19 Jul 2019, AIA has started to trace out a “Head & Shoulders” bearish configuration where it tends to form at the end of uptrend that indicates a potential topping process.
- The neckline support of the “Head & Shoulders” rests at 72.10 where a daily close below it triggers a multi-week decline towards the next significant medium-term support at 64.60 (major ascending support from Mar 2016 low & 1.00 Fibonacci expansion of the decline from 19 Jul to 14 Aug 2019 low projected from 12 Sep 2019 high).
Charts are from City Index Advantage TraderPro & eSignal
Latest market news
Yesterday 03:00 PM
Yesterday 01:12 PM
Yesterday 11:14 AM
Yesterday 08:28 AM
April 24, 2024 03:30 PM
Latest Indices articles

Yesterday 03:00 PM
April 24, 2024 03:30 PM
April 18, 2024 04:46 PM