


Telecoms could have some exciting times ahead of them with the rollout of 5G. However, competition is intense, and the sector is a notoriously difficult sector within which to achieve high margins. Customers and regulators will always try to get more for less. Additionally, the telecoms business often comes with large scale infrastructure which needs to be constantly improved and upgraded requiring more and more investment to remain cutting edge and ahead of the game.
BT
BT’s share price has crashed over 45% YTD and recently struck at an 11 year low after the decision to suspend dividends, in order to preserve cash amid covid uncertainty.
Whilst removing the dividend made sense, the dividend was one of the few factors preventing investors from jumping ship. BT now has a market cap of £10 billion, 4 times less than 5 years ago. When the dividend does eventually resume next year, it will most likely be a half the previous rate after management has taken the decision to invest heavily in BT’s next phase of the transformation.
BT has warned that the covid pandemic will result in a sharp fall in revenue and profits across the year. The dearth of sports and reduced activity by business clients are hitting its performance. BT Sports revenue dried up as live sporting fixtures came to a halt in lockdown. Insolvencies among small business customers are also a worry.
The need for significant modernisation and simplification across BT is clear. This includes digitalising customer journeys and moving customers onto the new 5G and fibre broadband. This of course comes at a price with £1.3 billion investment needed over 5 years. Covid is unlikely to have changed managements plans here.
Then there is the debt pile to consider which is a massive drain on cash. BT interest payments totalled £736 million just last year. However, the scale of decline at the company is alarming is probably now more alarming that the debt pile.
On the plus side BT Open reach and BT Sport are higher margin businesses and unique. BT could be considered a strong player in an extremely challenging industry.
BT Chart Thoughts
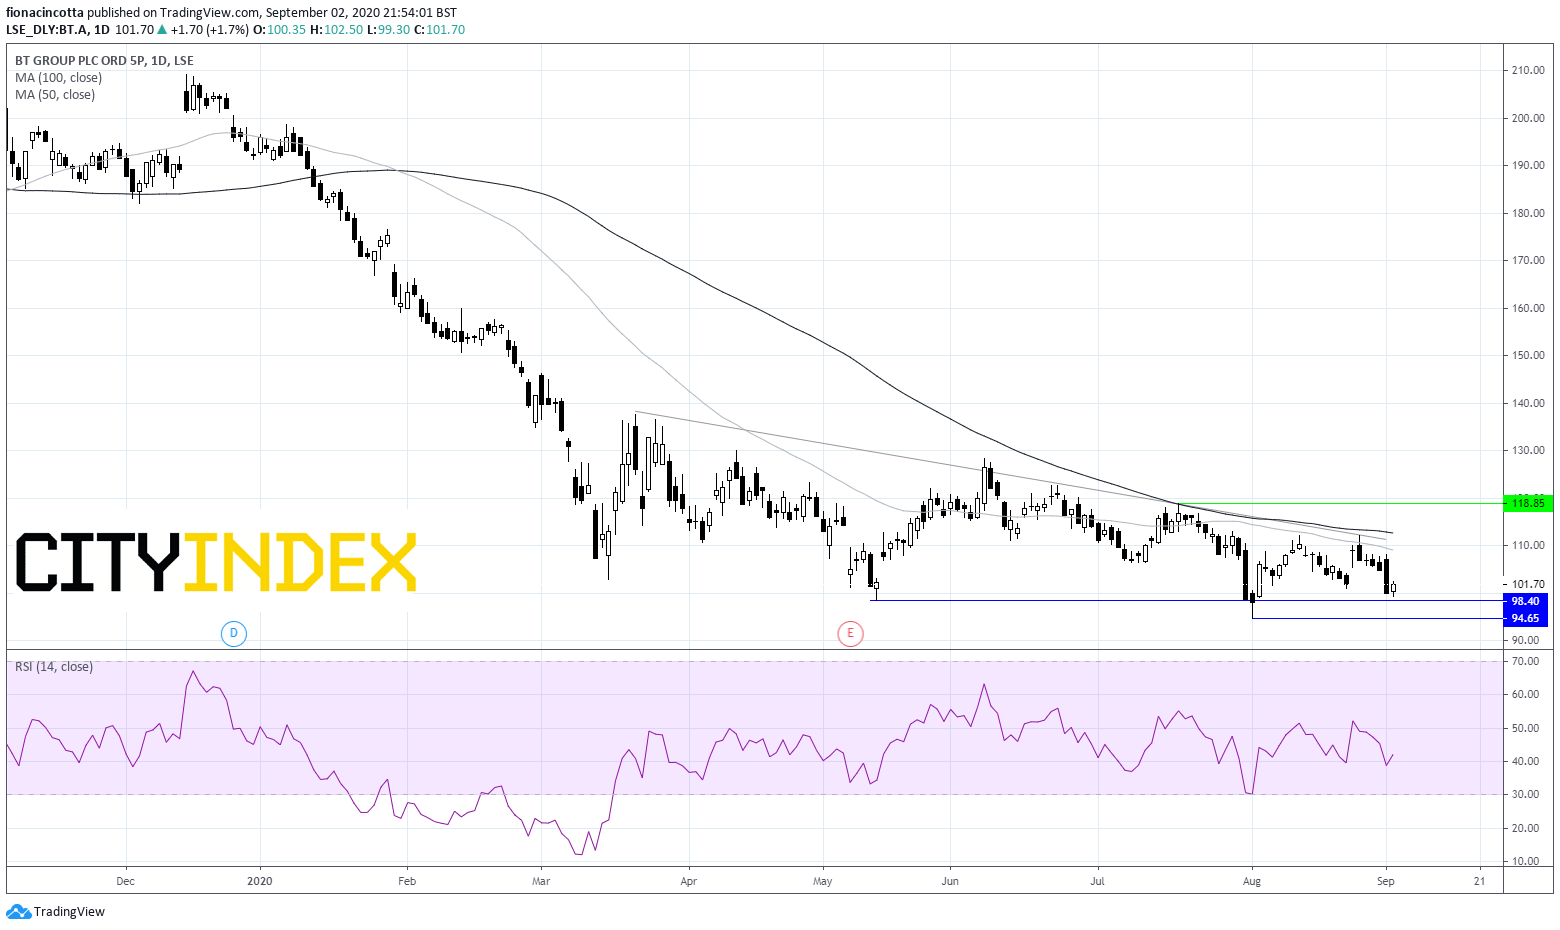
The stock is under-performing that broader market by around 14%. The stock has continued falling following the initial March covid sell off. It trades below its 50, 100 and 200 sma and below its descending trendline and is not even trading in overbought territory on the RSI, suggesting that there could be more downside to come.
98p has offered support of several occasions across the covid crisis. A fall below this level could see BT target 94p prior to targeting 80p its financial crisis low.
On the upside strong resistance can be seen around 110 – 113p where the 50 & 100 daily moving averages lies, and the descending trendline.
Vodafone
Roaming charges have been the biggest covid hit for Vodafone as travelling ground to a halt and roaming charges dried up. However, this should recover as travelling picks up again.
Debt at Vodafone is also a problem at EUE42.2 billion particularly following the purchase of Liberty Global Assets. The sale European Towers Assets and Vodafone Egypt could help bring down the debt pile. Although this does also mean the loss of a steady rent stream from the Towers.
Vodafone’s dividend has been a big part of the bull case. The dividend at Vodafone was slashed by 40% but not cut completely. The dividend still yields 6.4% - not a bad return at all and still supporting the bull case for many funds.Vodafone is looking to Liberty Global Assets for cross selling opportunities. Retention in this industry can be tough and is often improved when a customer has multiple products.
Even then, there is very little which differentiates one mobile firm from another other than price. Customers often go with the cheapest provider a lesson that Vodafone learnt the hard way with India and Spain.
Vodafone has under performed the broader market and could continue to do so for the foreseeable future.
Vodafone Chart Thoughts
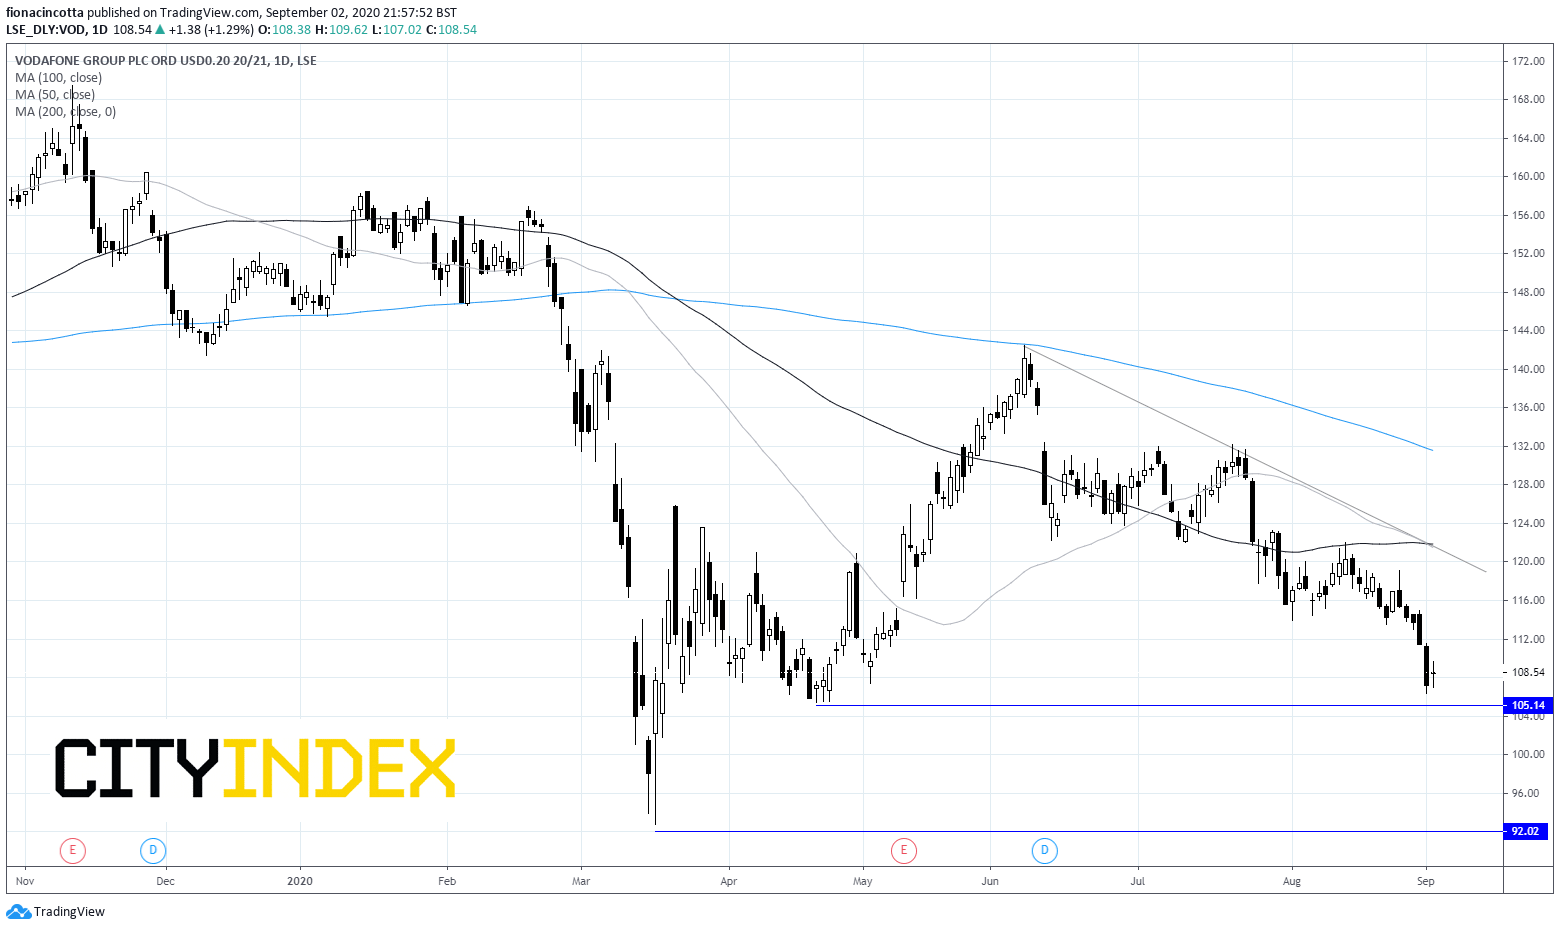
Vodafone dived to mid March low of 92p. The share price then recovered testing he 200 day moving average at 142p. The price has been on the decline since. It trades below its 50, 100- and 200-day moving average and below its descending trendline indicating more selling could still be on the cards.
Immediate support can be seen 105p, a level which held mid-April. A breakthrough here could open the door to 92p.
On the flip side, important resistance can be seen at 122p, where 50 and 100 sma and the descending trendline merge. A break through this level could see more buying action.
Latest market news
Today 11:14 AM
Today 08:28 AM
Yesterday 03:30 PM
Latest Equities articles
April 12, 2024 02:28 AM
April 7, 2024 08:46 PM
March 31, 2024 11:22 AM
