


October 19, 2021 9:48 PM
The US released September inflation data last week, with headline CPI at 5.4% and Core Inflation at 4%. In addition, US PPI was 8.6%, while the Core PPI was 6.8%. China’s PPI was 10.7% as well. All these prints were either the same or higher than August’s prints, with some at decade highs. (Note that China’s inflation rate was only 0.7% vs 0.8% in August, mainly due to steep declines in pork prices, down 46.9%!).
However, Wednesday is really inflation day. Below is a list of inflation data for September that will be released on Wednesday:
- Germany: PPI (12.7% YoY expected)
- UK: CPI (3.2% YoY expected)
- UK: Core CPI (3% YoY expected)
- UK: PPI Output (6.8% YoY expected)
- UK: PPI Input(11.6% YoY expected)
- UK: Retail Price Index (4.7% YoY expected)
- South Africa: CPI (5% YoY expected)
- South Africa: Core CPI (3.1% YoY expected)
- EU: CPI September (3.4% YoY expected)
- EU: Core CPI September (1.9% YoY expected)
- Canada: CPI (4.3% YoY expected)
- Canada: Core CPI (3.6% YoY expected)
- Russia: PPI (28.6% YoY expected)
Wednesday night US, Thursday morning Asia:
- South Korea: PPI (7.3% YoY expected)
Note that the Euro Zone September print is a final reading. This print doesn’t usually change much from the Flash Print, which is released on the last day of the previous month.
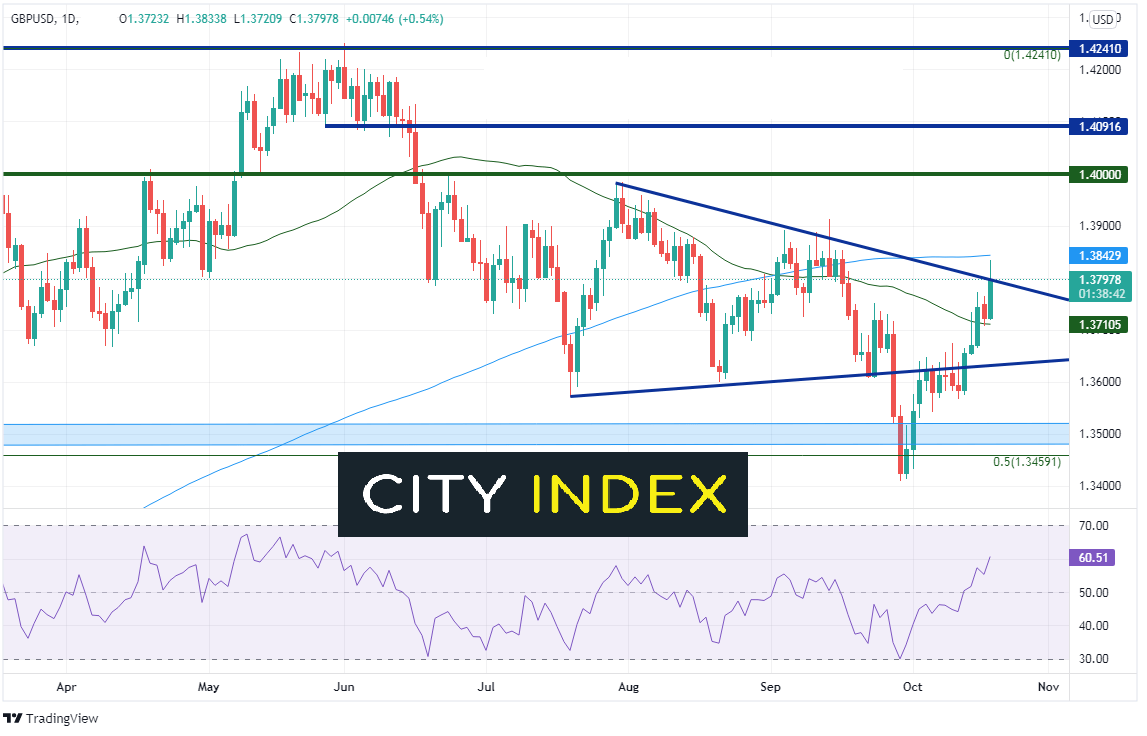
As discussed in the Currency Pair of the Week, GBP/USD has been moving higher as the BOE has been commenting recently as to how concerned they are about rising inflation. Markets are even pricing in a 25bps rate hike at their November meeting, which is before their bond buying programs expires at the end of the year. Inflation numbers on Wednesday may give a clue as which way the BOE will be leaning on November 4th! GBP/USD stalled at a high of 1.3833 on Tuesday, just below the 200 Day Moving Average at 1.3843. A higher than expected inflation reading could catapult the pair towards 1.4000!
Source: Tradingview, Stone X
Trade GBP/USD now: Login or Open a new account!
• Open an account in the UK
• Open an account in Australia
• Open an account in Singapore
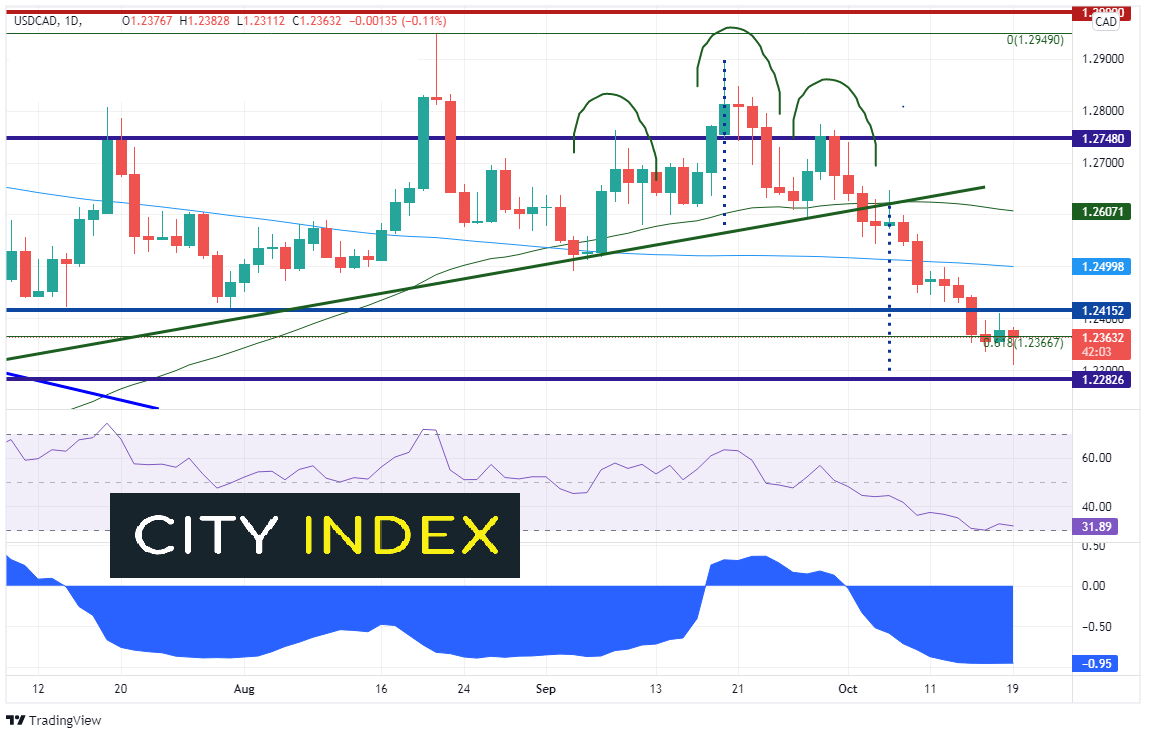
The Canadian Core CPI excludes food and energy. However, the Canadian Dollar tracks very closely with WTI Crude Oil. Perhaps the headline print may be more appropriate to watch than the Core CPI for Canada. The correlation coefficient between USD/CAD and WTI Crude Futures is -0.95, almost a perfect negative correlation between the 2 assets. USD/CAD has only had a positive close on 3 of the last 14 trading days. Price found support near the 61.8% Fibonacci retracement level from the June 1st lows to the August 20th highs, near 1.2366. On Tuesday, the pair formed a hammer candlestick formation as price made a new trend low, down to 1.2311, and bounced. 1.2300 is the target for the head and shoulders pattern, therefore USD/CAD may have gotten “close enough” to target. If the Canadian headline CPI print is weaker than expected, the pair may bounce towards 1.2415 resistance. The 200 Day Moving Average crosses above near 1.2500. Support is at Tuesday’s lows 1.2311 and then the June 23rd lows, near 1.2254.
Source: Tradingview, Stone X
Trade USD/CAD now: Login or Open a new account!
• Open an account in the UK
• Open an account in Australia
• Open an account in Singapore
With all that inflation data due out Wednesday, some currency pairs could get volatile, especially those currently close to support or resistance levels. With the number of countries reporting inflation data on Wednesday, traders should get a better idea as to if inflation around the globe has plateaued or if it is still rising.
Learn more about forex trading opportunities.


