


March 4, 2022 3:35 PM
The Nonfarm payroll report showed that the US added 678,000 jobs to the economy in February. This was versus an expectation of +400,000 and a higher revision to the January print to +481,000. In addition, the Unemployment Rate fell to 3.8% from 4%. This was primarily due to the increase in the Labor Participation Rate to 62.3% vs 62.2% last. The key participation rate number has not had a decline since May 2021, showing that people continue to return to the jobs market. The one worrisome piece of data for the Fed when they meet in mid-March is Average Hourly Earnings. The Fed wants to see this number increase with inflation. However, in February, the key inflation metric dropped to 0% MoM vs an expectation of 0.5% MoM and 0.6% MoM in January. This pulled the YoY rate down to 5.1% from 5.5% in January.
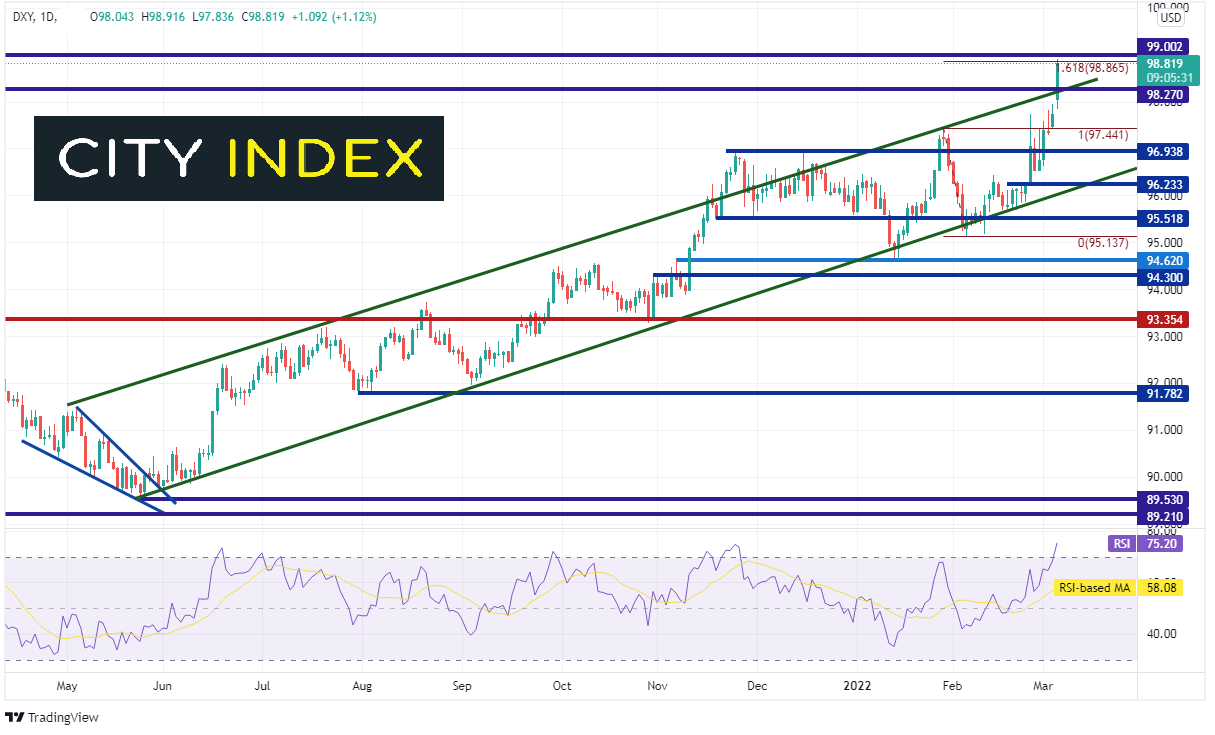
The DXY had been moving higher before the jobs report and the weaker Average Hourly Earnings number did not slow it down! The Dollar Index moved higher above the top trendline of the rising channel the pair has been in since May 2021. It also broke above horizontal resistance at 98.27, moving to its highest level since May 2020. Thus far, the DXY has held long term resistance at 99.00, as well as the 161.8% Fibonacci extension from the highs of January 28th to the lows of February 4th at 98.87. However, notice that the RSI is in overbought territory, indicating the pair may be ready for a pullback. Support is at the confluence of the rising trendline and the previous horizontal resistance (now support) near 98.27, then the January 28th highs at 97.44.
Source: Tradingview, Stone X
Trade the DXY now: Login or Open a new account!
• Open an account in the UK
• Open an account in Australia
• Open an account in Singapore
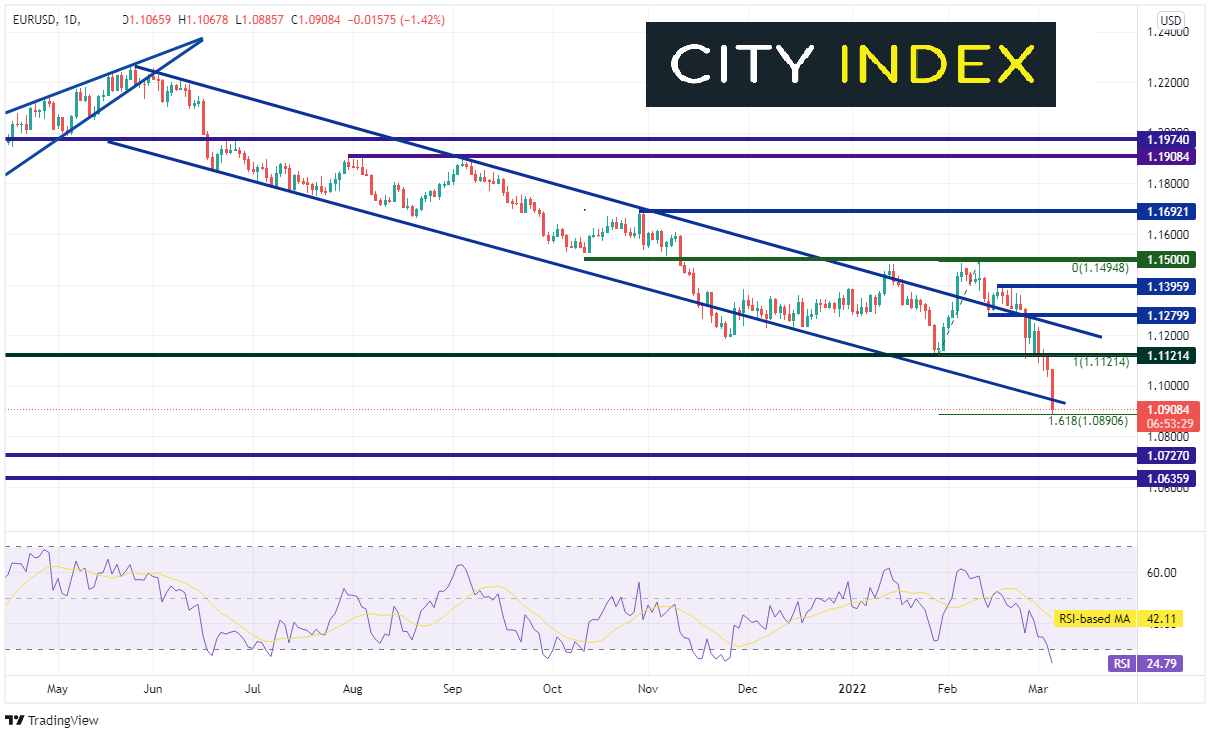
As the EUR/USD makes up nearly 58% of the DXY, the pair has been moving aggressively lower since making highs near 1.1500 on February 10th. Today the pair broke lower and took out the bottom trendline of the channel that the pair has been in since May 2021. Thus far, the pair halted at the 161.8% Fibonacci extension from the lows of January 28th to the highs of February 10th near 1.0890. If EUR/USD breaks below, the next level of support isn’t until long term support dating to April 2020 near 1.0727, then the March 2020 lows at 1.0636. However, notice that the RSI is in oversold, meaning the pair may be ready for a bounce. First resistance is at the January 28th lows of 1.1121, then the top downward sloping trendline of the long-term channel near 1.1250. Horizontal resistance sits just above there at 1.1280.
Source: Tradingview, Stone X
Trade EUR/USD now: Login or Open a new account!
• Open an account in the UK
• Open an account in Australia
• Open an account in Singapore
Although the headline Non-Farm Payroll print for February was strong, the Average Hourly Earnings number was weak. However, the Fed has already signaled a 25bps hike for March, and one data point is unlikely to sway their decision, especially with soaring inflation. The DXY is moving higher and EUR/USD moving lower. What the technical levels for area where price may pause or even reverse!
Learn more about forex trading opportunities.


