Stocks Wall Street rally could run out of steam soon
US stock markets have defied gravity and confounded many traders and analysts alike. The bulls have been raging through Wall Street and key technical levels […]
US stock markets have defied gravity and confounded many traders and analysts alike. The bulls have been raging through Wall Street and key technical levels […]
US stock markets have defied gravity and confounded many traders and analysts alike. The bulls have been raging through Wall Street and key technical levels have been taken out despite the soft patch in global economic data and weakness in third quarter earnings. Evidently, investors are hoping to see some more central bank action from the likes of the Bank of Japan, People’s Bank of China and the European Central Bank, and inaction from the likes of the Bank of England and US Federal Reserve, with the latter being so close to hiking interest rates. Meanwhile the sellers have also been disappointed by the resilience of the markets and they are probably easing off the gas, either willingly or by force (i.e. being stopped out). But with the rally gathering momentum amid falling volumes, earnings mostly disappointing the already-low expectations and commodity prices remaining soft, are we climbing a wall of worry? Are the markets about to fall off a cliff? If the trend of weaker US corporate earnings continues then there is not a lot supporting this market, apart from, well, hopes for lower interest rates for longer.
Technical outlook: Dow Jones
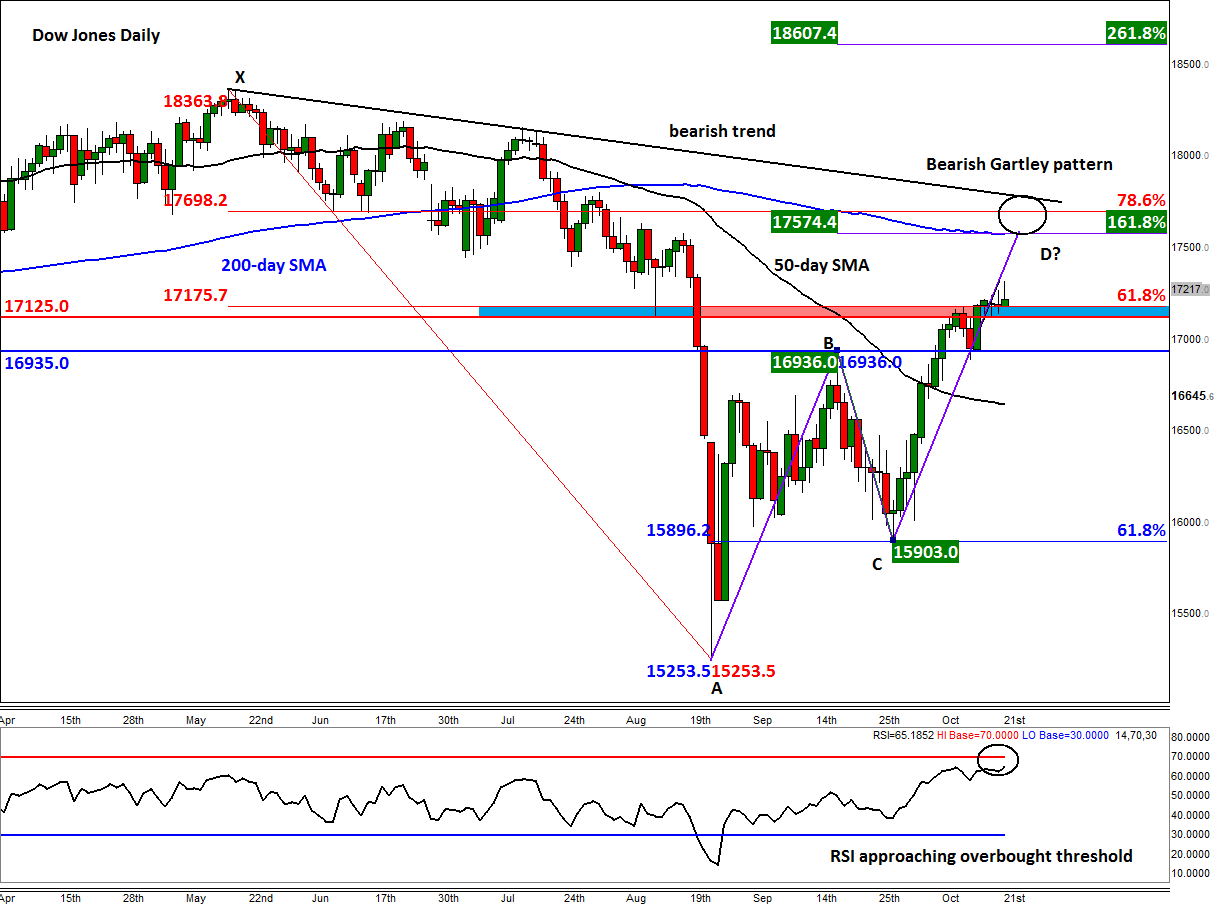
As can be seen from the chart, the Dow has taken out a key area of resistance, potentially paving the way for further short-term gains. The index has broken above the 50-point resistance range between 17125 and 17175. This area had been support and resistance in the past and corresponds with the 61.8% Fibonacci retracement level of the move down from the record high that was achieved back in May (i.e. point X). This area may now be the new support zone, although a potential break below here would be bearish. At the time of this writing, the index had retreated from its earlier best levels but it was still holding above this support area.
However even if the bulls manage to hold their ground above 17125-75, a more significant resistance zone is approaching, so the joy could be short-lived for the bulls. The next area of resistance is between 17575 and 17775. If the market has already peaked, we should see some strong resistance here, else a revisit of the previous record high could be on the cards. Several technical indicators converge around this area. They include:
The convergence of several technical factors along with the harmonic price action and fact the RSI is approaching the overbought threshold of 70 means the Dow is rallying towards a Bearish Gartley pattern. If this bearish pattern comes to fruition, the index could drop several hundred points at the very least and there is even the possibility for the next leg of a major downward move to start from here. The bears might therefore be thinking: “come to papa” in the view of mauling the bulls later.
That being said, if the bearish conviction is not strong enough around this 17575-775 area and the bulls manage to retake control here, then there won’t be much further resistance to stop the rally until at least the previous record high.