


The best floor stock markets have found all week is looking shaky
The uptick followed U.S. President Donald Trump’s tweet proclaiming that China’s Vice Premier Liu He is “now coming to the U.S. to make a deal". As such, stocks are taking formal confirmation of USTR plans to raise tariffs to 25% from 10% on Friday in their stride. Presumably, the backstory showing tariff hikes reaching unsustainable levels, is gaining traction. At just short of 8%, the weighted mean of tariff rates levied by the U.S. would be second only to those of Brazil, after Friday’s planned rise. That looks crazy. Such incongruity is one reason markets do not appear to be taking this week’s events as seriously as the last flare up in the trade dispute; at least not yet.
Figure 1: U.S. tariff levels are set to rise above EM rates
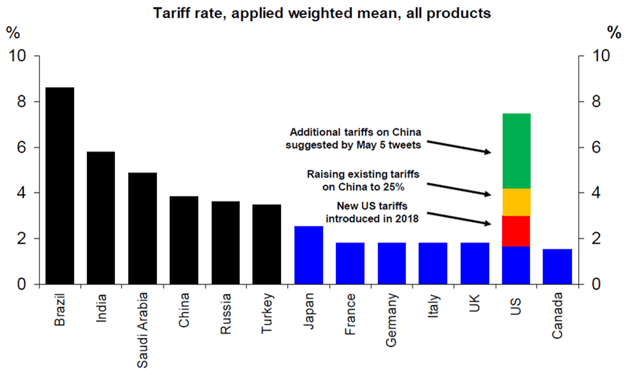
Source: Deutsche Bank, Bloomberg, City Index
Markets are telegraphing an expectation that even if tariffs are raised on Friday, they will be lowered relatively quickly, following a deal that Washington and Beijing indicated was close just days ago. This interpretation holds obvious risks. Lack of visibility alone—chiefly into the mind of the U.S. president—suggests volatility could remain heightened till Thursday, at best. That’s the first day of talks scheduled with Premier Liu. At worst, in the event that U.S. tariffs rise, and Beijing goes ahead with its threat to retaliate, a deeper correction of risk assets could be seen.
Thoughts on Dow futures
As noted several times over the last few months, the Dow Jones Industrial Average has been a standout amongst major U.S. indices due to underperformance. With renewed chances that valuation, economic and trade concerns could challenge the global market uptrend anew, Dow’s fault lines could be indicative. Attention remains focused on the cluster of support and resistance ensnaring the Dow between 25246-26696 since late February. Dow’s failure to breach April highs on at least three clear attempts, now looks like a precursor. Yet Tuesday’s sharp selling left the key 78.6% (25773) Fibonacci interval of October-December mayhem intact. If it continues to hold, the risk-averse episode could be short. Still, this week’s swing to ‘risk-off’, has re-established upside challenges. These include 26317, set by November’s ominous long-legged doji. Dow’s cycle high of 26696 is another. The sense that a cohort of the Dow’s select industrial giants could remain a drag on markets’ near-term trajectory well beyond this week, is difficult to shake.
Price chart: CBOT e-Mini Dow futures (‘continuous’) – Daily [08/05/2019 19:27:37]
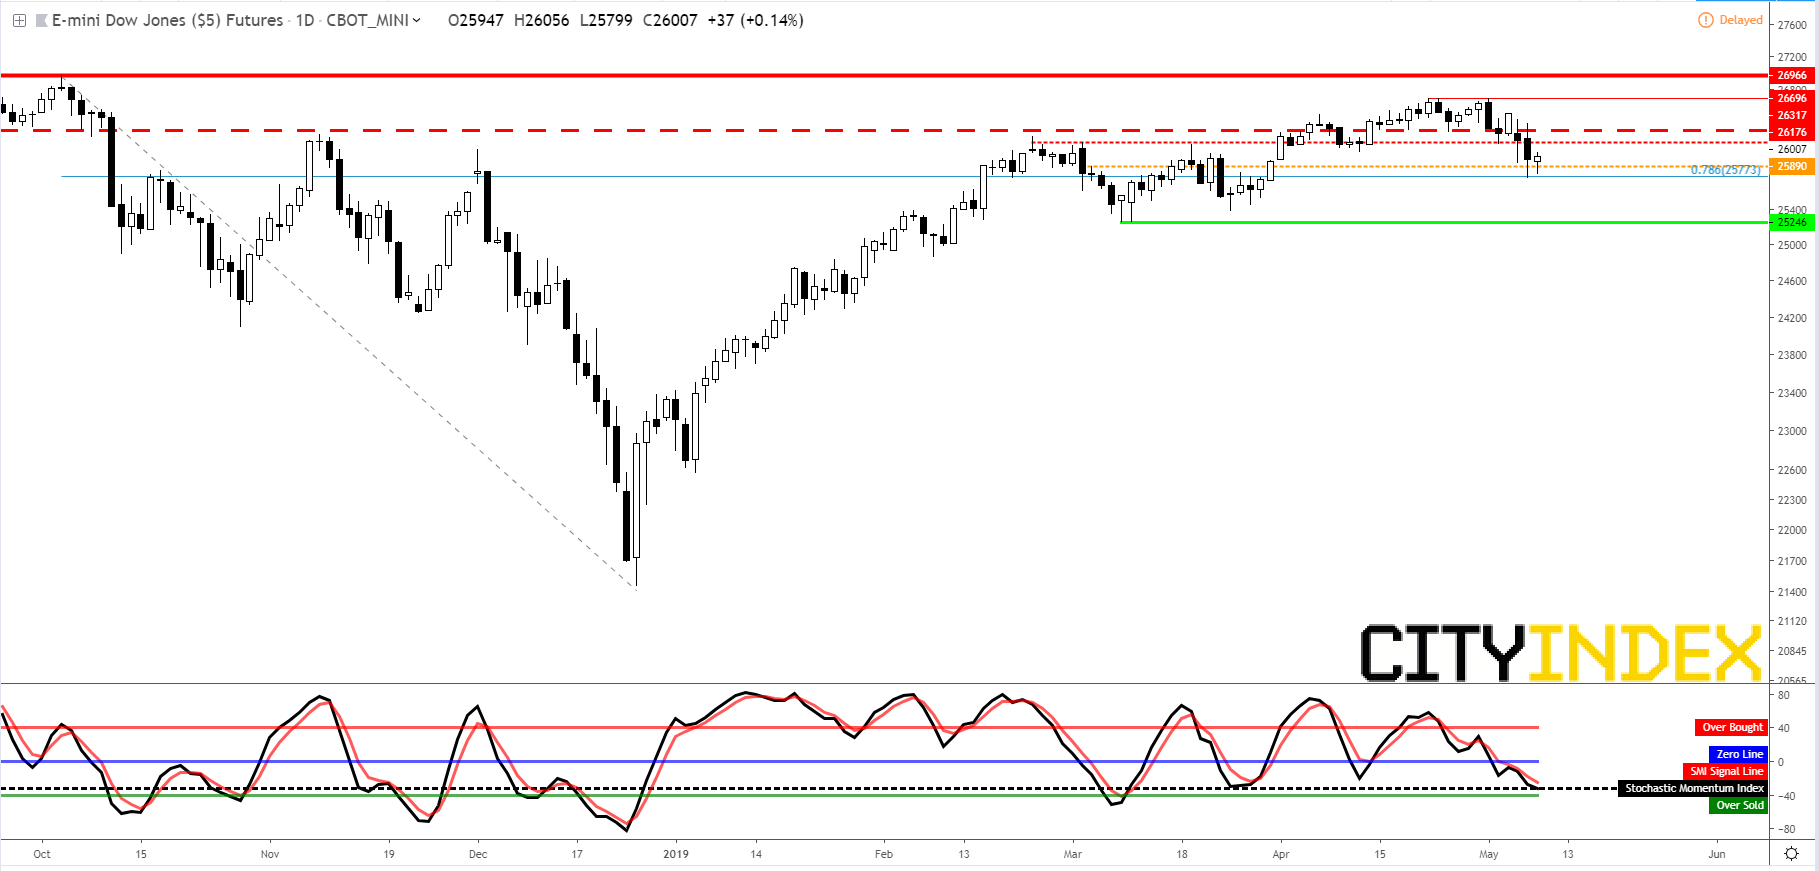
Source: Tradingview/City Index
Latest market news
Latest Trump articles
November 16, 2022 05:30 AM
November 8, 2022 05:13 AM
June 24, 2021 11:31 AM
December 29, 2020 01:55 PM