


July 20, 2021 5:21 PM
Stocks reverse while yields hammer out a bottom
Turnaround Tuesday strikes again! Stocks reversed course today and are up nearly 1.75% as the S&P 500 traded above yesterday’s highs, near 4328. Just as we have seen several times since the large index began forming the rising wedge in the fall of 2020, a large selloff one day as been followed by a larger positive move the next day. Today’s move resembles that of June 22nd, when price reversed the previous day’s selloff and continued moving higher within the wedge. The key for the S&P 500 will be to see if the index can close back into the wedge and make new highs, just as it has been doing for the last 9 months. However, if the index fails and closes below the July 19th lows and horizontal support, it can easily move to the June 21st lows of 4252.75.
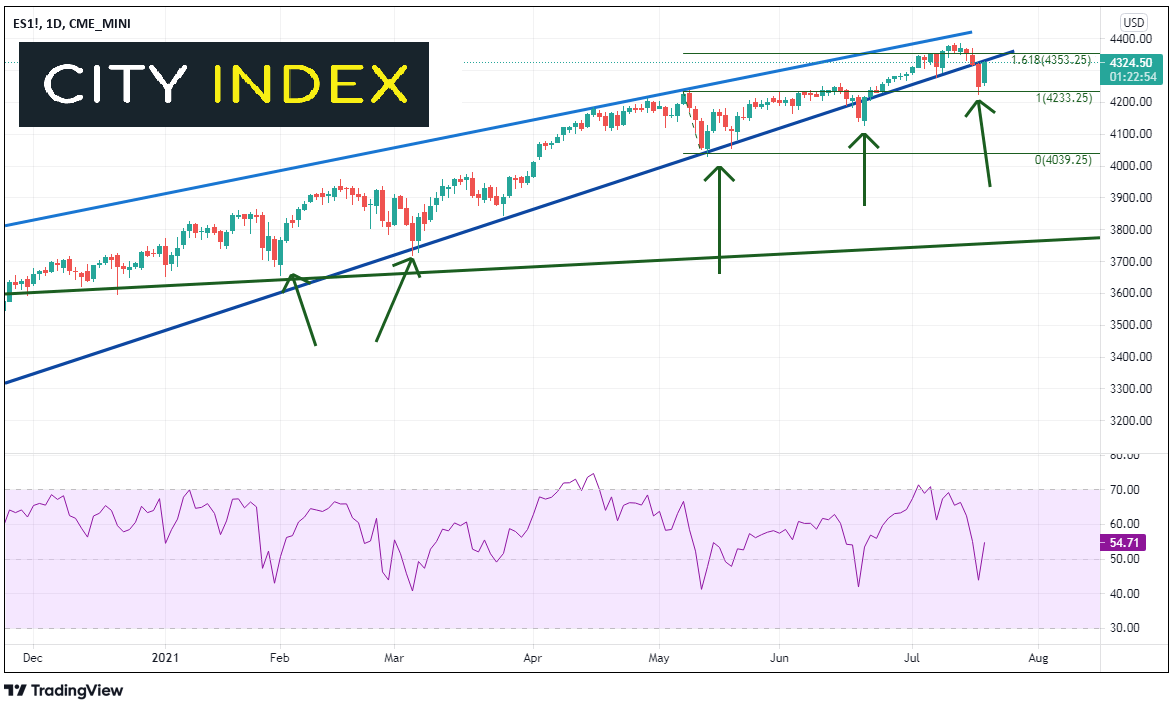
Source: Tradingview, City Index
The candlestick formation on a daily chart of 10-year yields is a hammer formation, in which yields open near yesterday’s close, make a new low, and recover to close near the highs of the day. A hammer is a one candle reversal signal. The benchmark yields moved as lows as 1.129 today before reversing, as it struggles to hold a key level near horizontal support at 1.200 and the 38.2% Fibonacci retracement level from the March 9th, 2020 lows to the March 30, 2021 highs near 1.227. Monday’s highs provide first resistance at 1.2900, ahead of horizontal resistance at 1.423. Support below Tuesday’s low is the 50% retracement level from the previously mentioned timeframe near 1.056 and then the psychological round number support level of 1.000. Notice that yields in a new low today while the RSI did not!
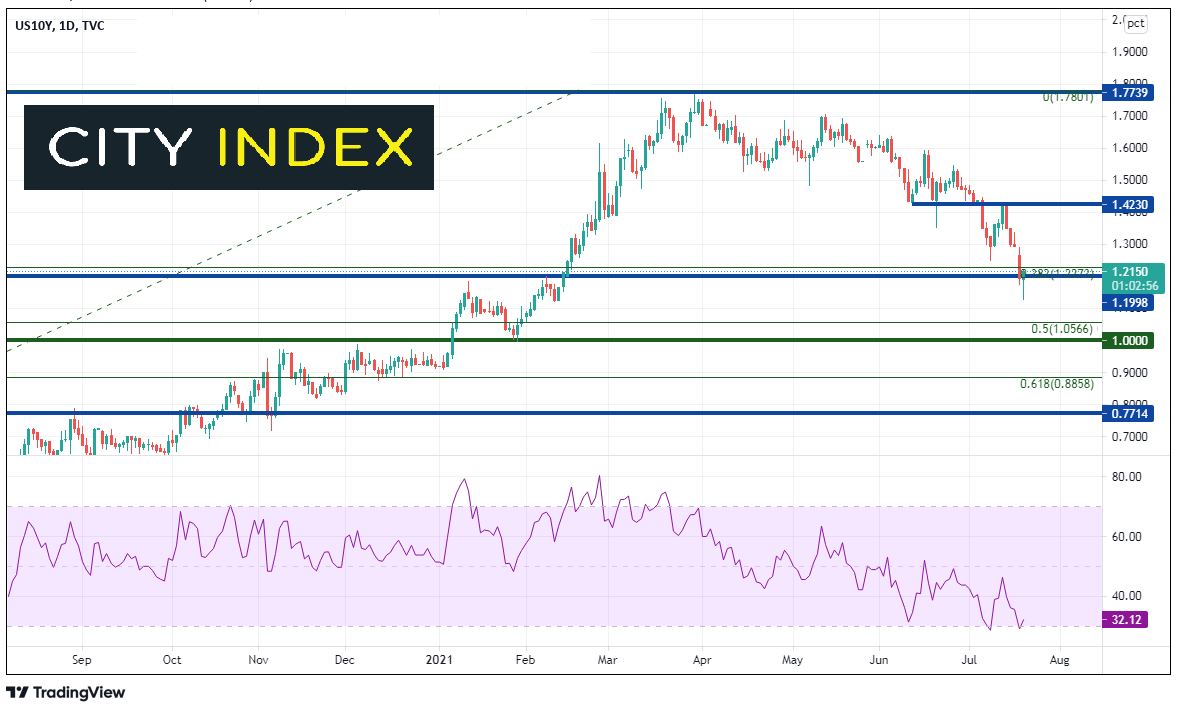
Source: Tradingview, City Index
Japanese candlestick cheatsheet
If the S&P 500 is going to continue to move higher, its going to have to take out trendline resistance and make new all-time highs. The hammer in yields confirms the move higher in stocks today. The question traders need to be asking right now is: What is the catalyst that will help stocks to continue to move higher and bonds move lower (yields higher)?
Latest market news
Yesterday 11:48 PM
Yesterday 11:16 PM
Yesterday 05:00 PM
Yesterday 01:13 PM
Latest Bonds articles
April 10, 2024 01:09 AM
March 19, 2024 02:30 AM
March 15, 2024 01:38 AM
March 12, 2024 06:20 AM