


Following Monday’s big drop when the Nasdaq closed at its lowest level since November 2020, US index futures rebounded sharply to start the day. But with the lack of any fundamental news, this looks like a short covering rebound from oversold levels. As such, I continue to expect further weakness is likely. If anything, there is a risk that fears over stagflation and tighter monetary conditions may intensify, especially if US inflation data on Wednesday reveals CPI did not ease to 8.1% as expected from 8.5% y/y in March.
In fact, judging by the ISM manufacturing and services PMI reports, prices paid continued to rise in April – although at a slower pace in the case of the manufacturing sector, but still near record highs. Also on the rise were supplier delivery times for manufacturing and services. On top of this, the University of Michigan’s consumer inflation expectations report revealed the 1-year outlook is at a 40-year high.
As such, it would be brave to talk about peak inflation just yet. Even if inflation peaks this month, it could go back down very slowly. In any case, as the Fed and other major central banks have started or about to start quantitative tightening, equity prices are likely to remain volatile for a long time. So, any short-term strength should be treated with extra care.
Indeed, it is worth pointing out that some of the bearish speculators who may have missed out on the big drop, may well step in now that we have seen a decent bounce. Meanwhile, trapped longs may use this as an opportunity to lighten up. This is because the S&P has been making lower lows and lower highs for much of this year inside a wide corridor:
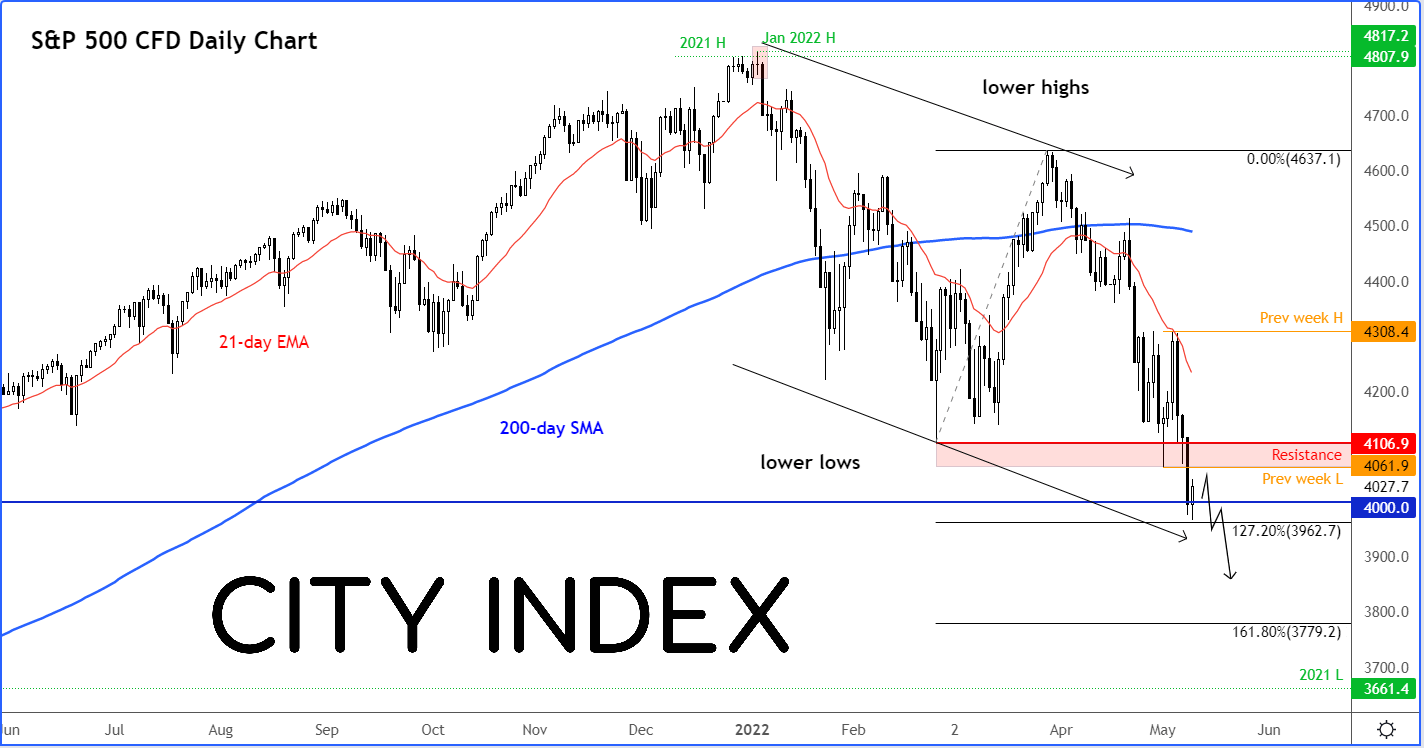
Source: StoneX and TradingView.com
More recently, the periods when the market has been in a recovery mode have shrunk while sell-off phases have steepened. This is a reflection of investor pessimism growing, as highlighted for example by the Nasdaq wiping out its entire 2021 gains following Monday’s sell-off. The S&P 500 has – for now – remained more than 8% above its corresponding 2021 low as at Monday’s close. That’s not to say it won’t eventually get there, but clearly highlights the fact that techs have been underperforming. The key question going forward is whether other sectors of the equity markets may also be dragged lower.
How to trade with City Index
You can trade with City Index by following these four easy steps:
-
Open an account, or log in if you’re already a customer
• Open an account in the UK
• Open an account in Australia
• Open an account in Singapore
- Search for the company you want to trade in our award-winning platform
- Choose your position and size, and your stop and limit levels
- Place the trade
Latest market news
Today 08:33 AM
Latest Trade Ideas articles