


Citigroup (C)
click to enlarge charts
Key technical elements
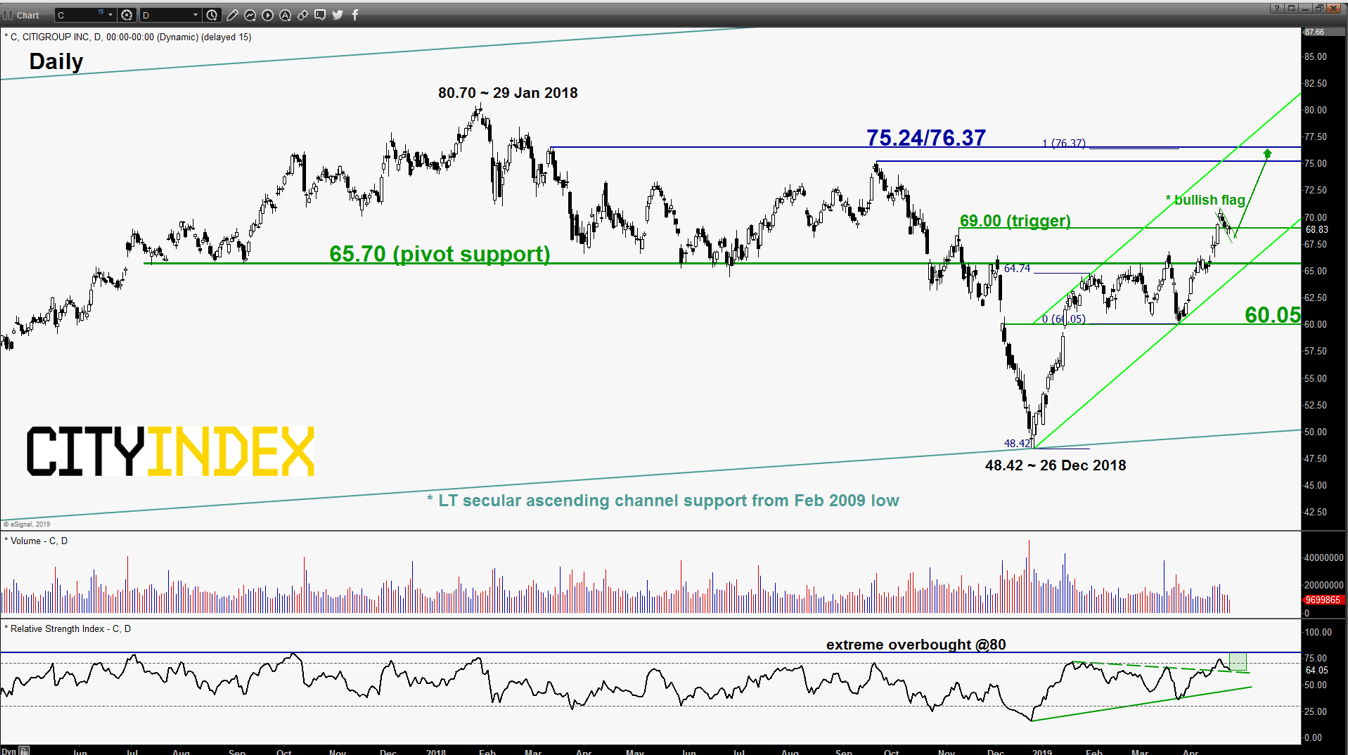
- Since its high of 70.75 printed on 17 Apr 2019, the share price of Citigroup has declined by 3.7% to print a low of 68.38 on 23 Apr 2019. Interestingly, the decline has evolved into a positive “bullish flag” continuation chart pattern with is upper boundary/resistance at 69.00.
- Momentum remains positive as the daily RSI oscillator has not flash any bearish divergence signal and still has potential room to manoeuvre to the upside before it reaches an extreme overbought level of 80.
- Th key medium-term support rests at 65.70 which is defined by the former swing high area of 01/18 Mar 2019 and the lower boundary of the medium-term ascending channel from 26 Dec 2018 low.
- The next significant medium-term resistance stands at 75.24/76.37 which is defined the swing high areas of 13 Mar/21 Sep 2018 and 1.00 Fibonacci expansion of the up move from 26 Dec 2018 low to 30 Jan 2019 high projected from 25 Mar 2019 low.
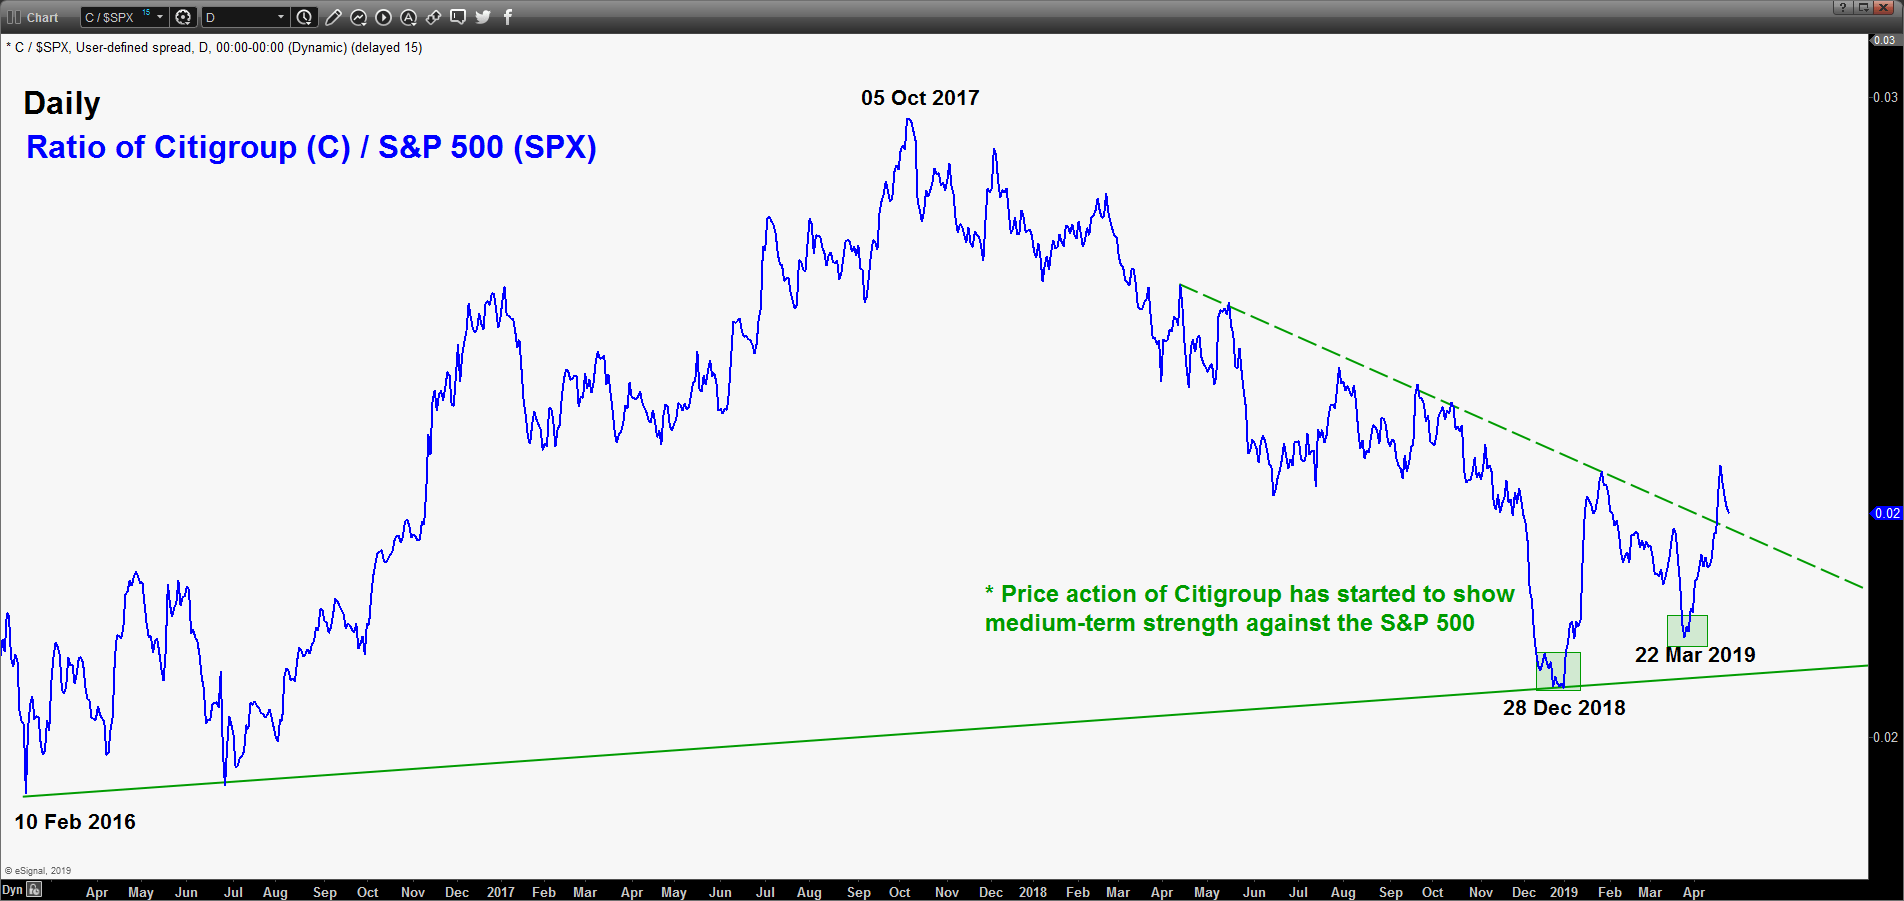
- The ratio of Citigroup / S&P 500 has started to exhibit medium-term strength seen in the share price movement of Citigroup against the S&P 500.
Key Levels (1 to 3 weeks)
Pivot (key support): 65.70
Resistances: 69.00 (trigger) & 75.24/76.37
Next support: 60.05
Conclusion
If the 65.70 key medium-term pivotal support holds and a break above 69.00 is likely to reinforce another potential upleg for Citigroup to target the 75.24/76.37 resistance zone.
However, a break with a daily close below 65.70 invalidates the bullish scenario for a corrective decline towards the next support at 60.05 (25 Mar 2019 swing low & close to 50% Fibonacci retracement of the entire 3-month up move from 26 Dec 2018 low to 17 Apr 2019 high).
Charts are from eSignal
Latest market news
Today 05:00 PM
Today 07:55 AM
Today 04:47 AM
Latest Shares market articles
November 2, 2023 01:41 PM
November 1, 2023 01:33 PM
October 31, 2023 01:15 PM
October 31, 2023 10:24 AM