


S&P 500 – Uptrend remains intact
click to enlarge charts
Key Levels (1 to 3 weeks)
Intermediate support: 3195
Pivot (key support): 3155
Resistances: 3250 & 3280/3300
Next support: 3070
Directional Bias (1 to 3 weeks)
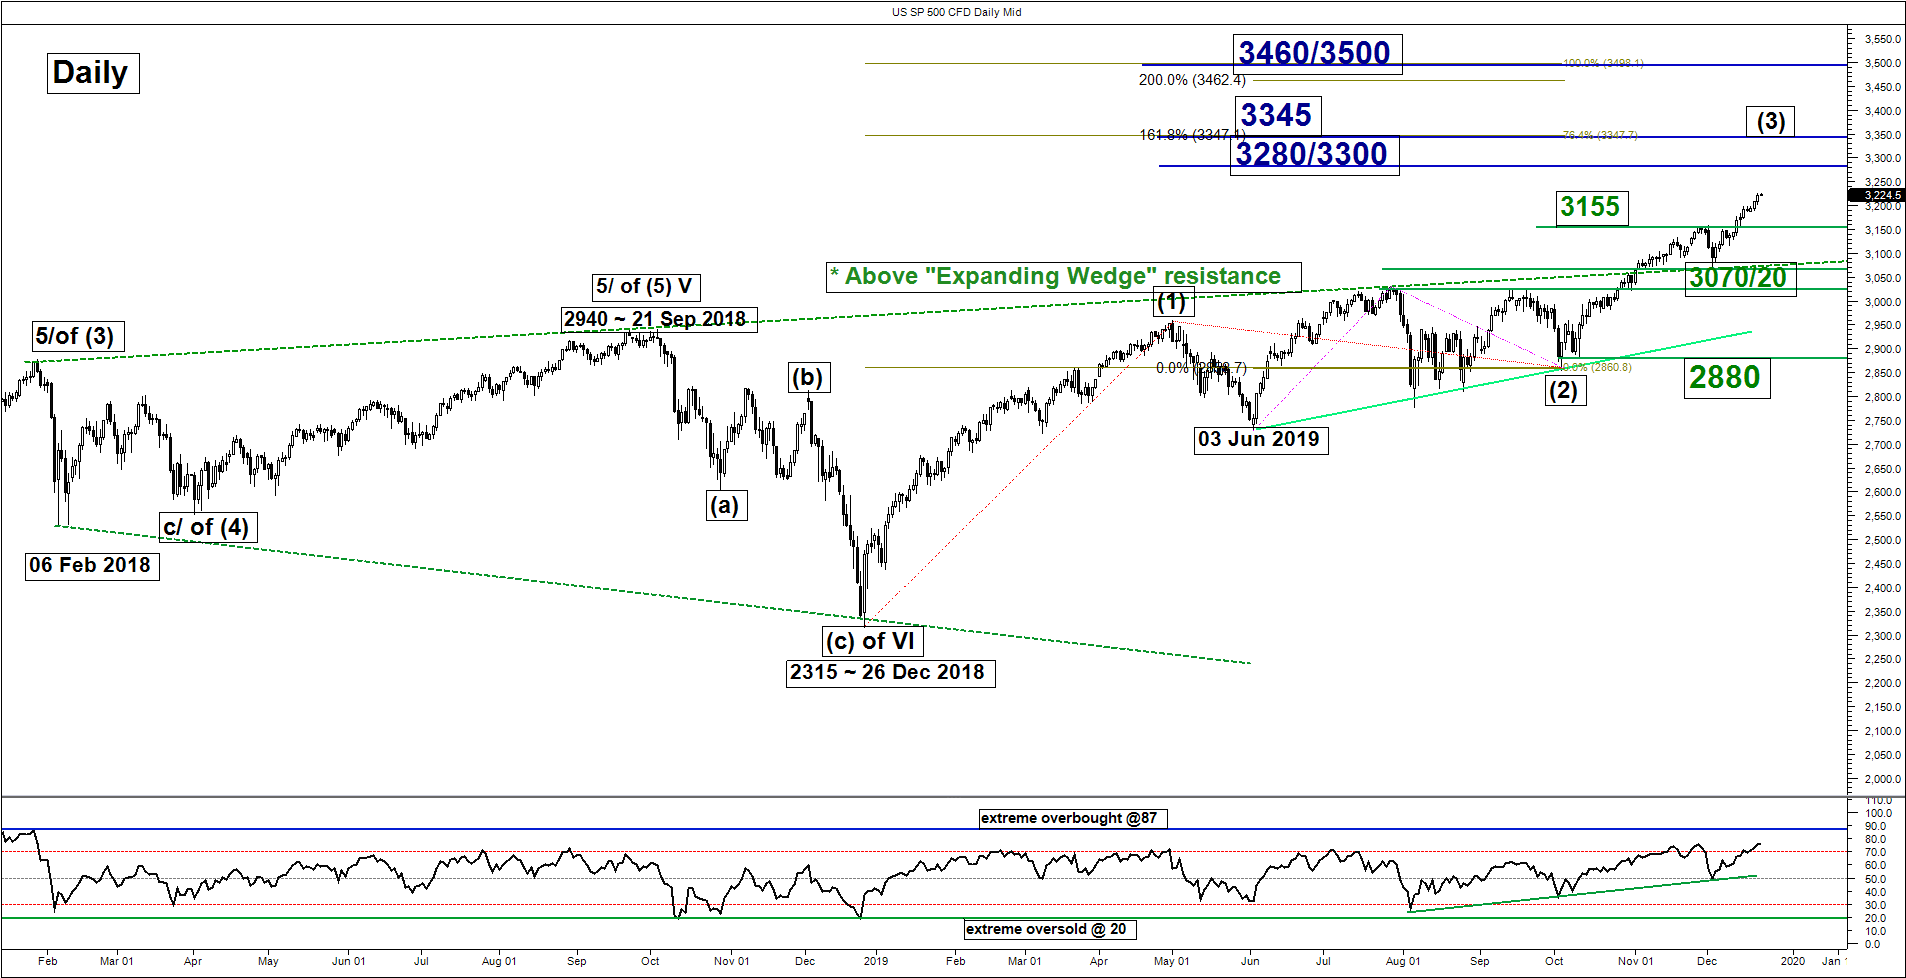
Last week, the SP 500 Index (proxy for the S&P 500 futures) has pushed up as expected and hit the first medium-term target/resistance at 3200/220 (printed an intraday high of 3226 on last Fri, 20 Dec). Click here for a recap on our previous report.
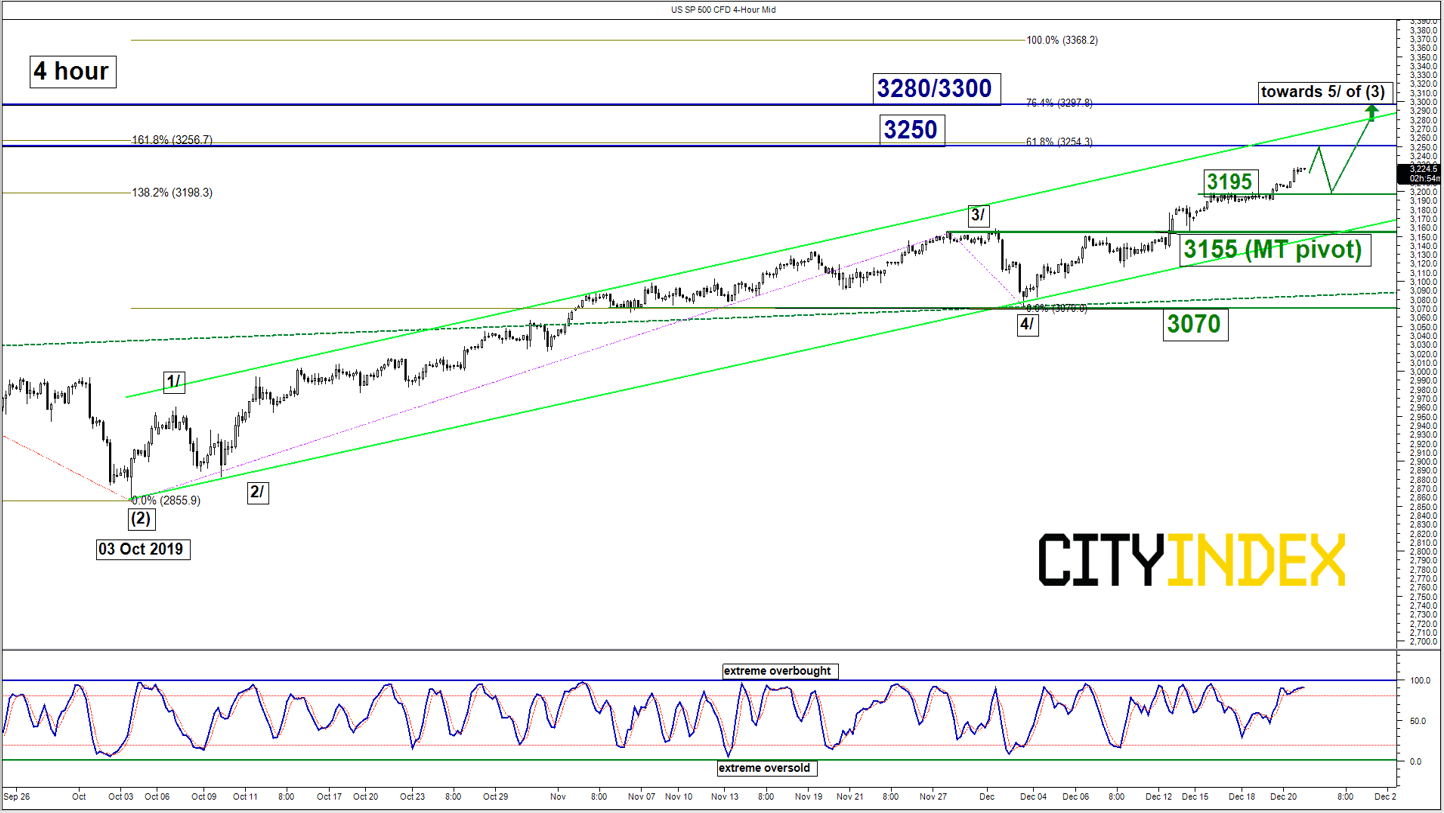
No clear signs of bullish exhaustion yet; we maintain the bullish bias in any pull-back/dips with an adjusted key medium-term pivotal support at 3155 for another potential impulsive upleg to target the next resistances at 3250 and 3280/3300 next.
On the other hand, a break with a daily close below 3155 invalidates the bullish scenario to trigger a multi-week corrective down move sequence towards the next support at 3070.
Key elements
- The daily RSI oscillator has reached its overbought region but no sign of bearish divergence yet and it still has some room to manoeuvre to the upside before it reaches an extreme overbought level of 87. These observations suggest that medium-term upside momentum remains intact.
- The 3155 key medium-term support is defined by the lower boundary of an ascending channel in place since 03 Oct 2019 low and a Fibonacci retracement cluster.
- The upper boundary of the aforementioned ascending channel is now acting as a resistance at 3280/3300 which also confluences with a Fibonacci expansion cluster.
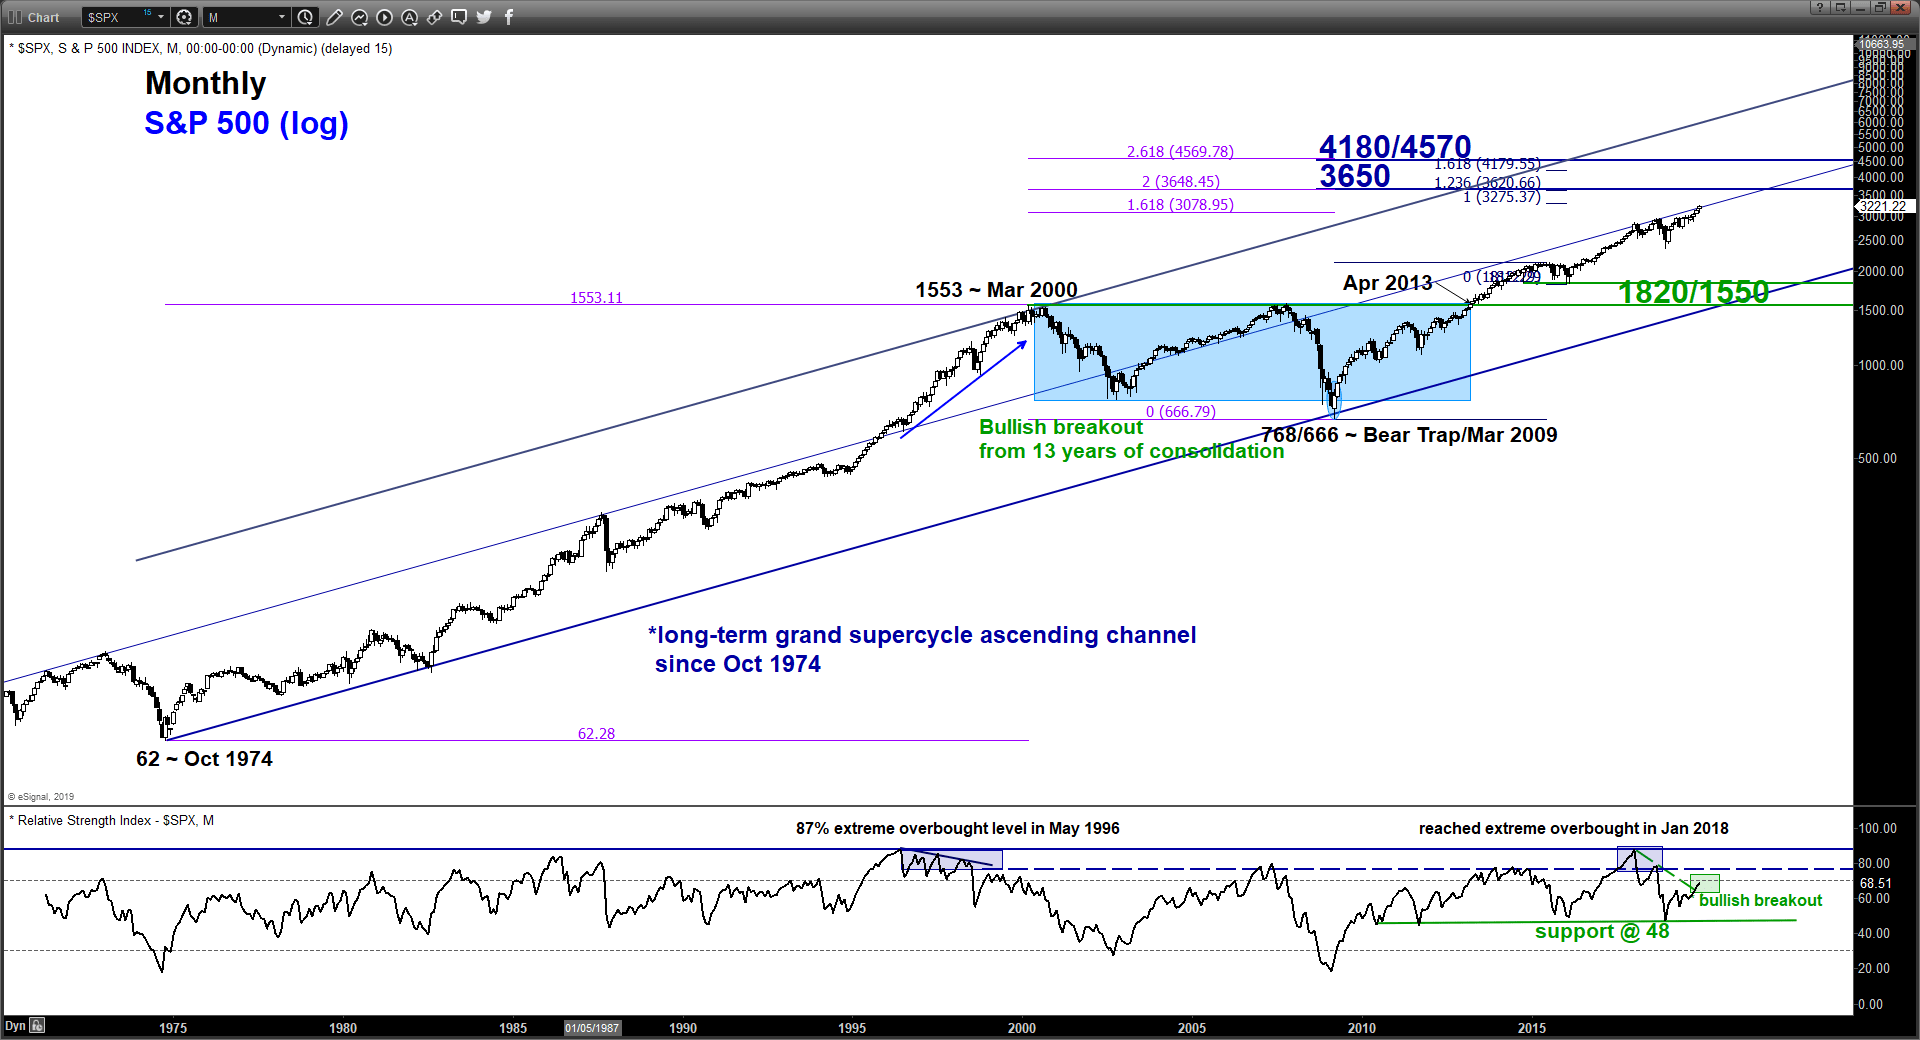
- Its longer-term monthly chart has also exhibited positive configurations with its price action now attempting (6 more days before the monthly Dec candlestick ends) a breakout above the median line of the grand super cycle ascending channel in place since Oct 1974 low in conjunction with a bullish breakout seen on its monthly RSI oscillator after a retest on its key support at the 48 level.
Nikkei 225 – 23540 remains the key medium-term support to watch
click to enlarge charts
Key Levels (1 to 3 weeks)
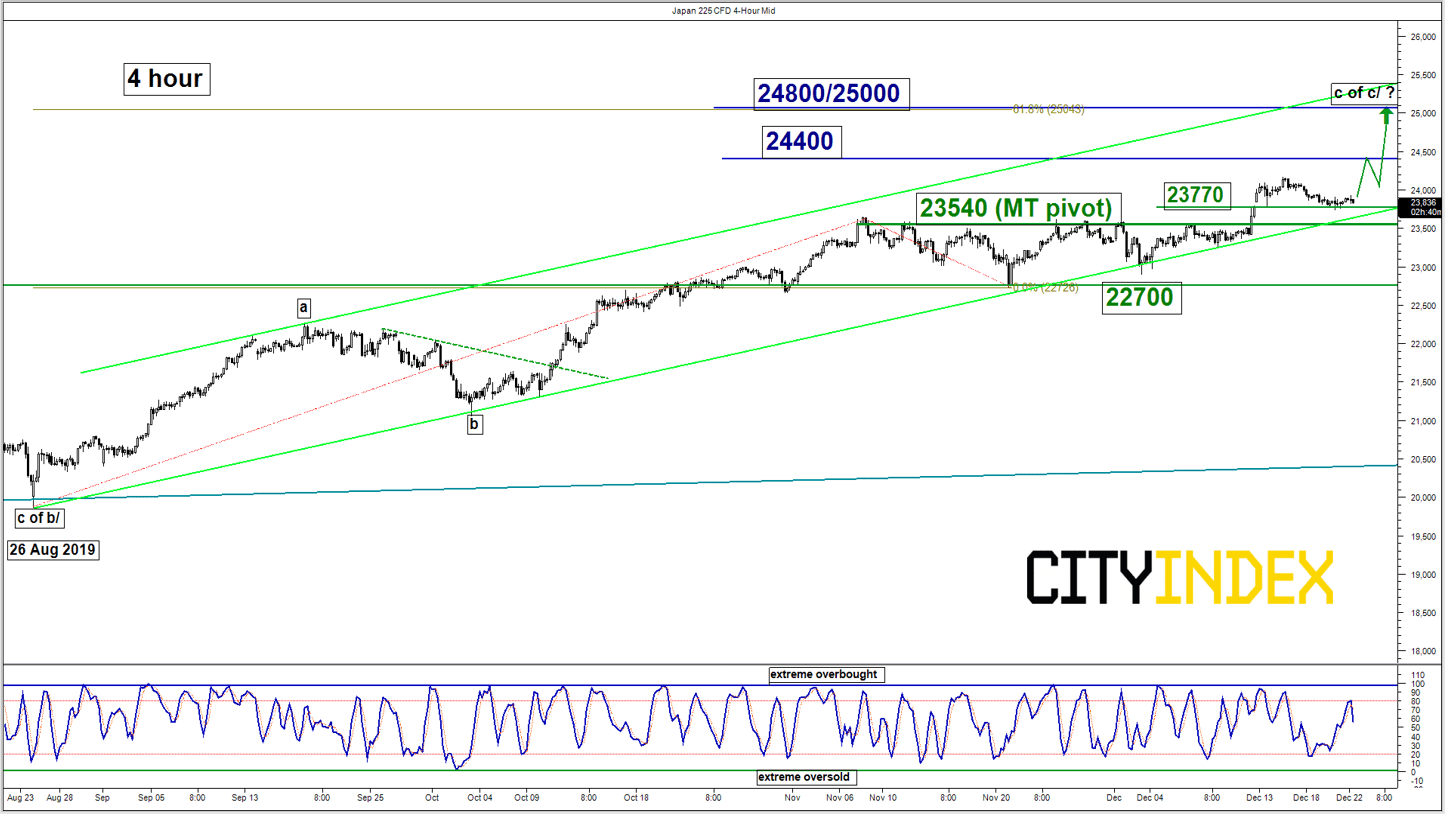
Intermediate support: 23770
Pivot (key support): 23540
Resistances: 24400 & 24800/25000
Next supports: 22700
Directional Bias (1 to 3 weeks)
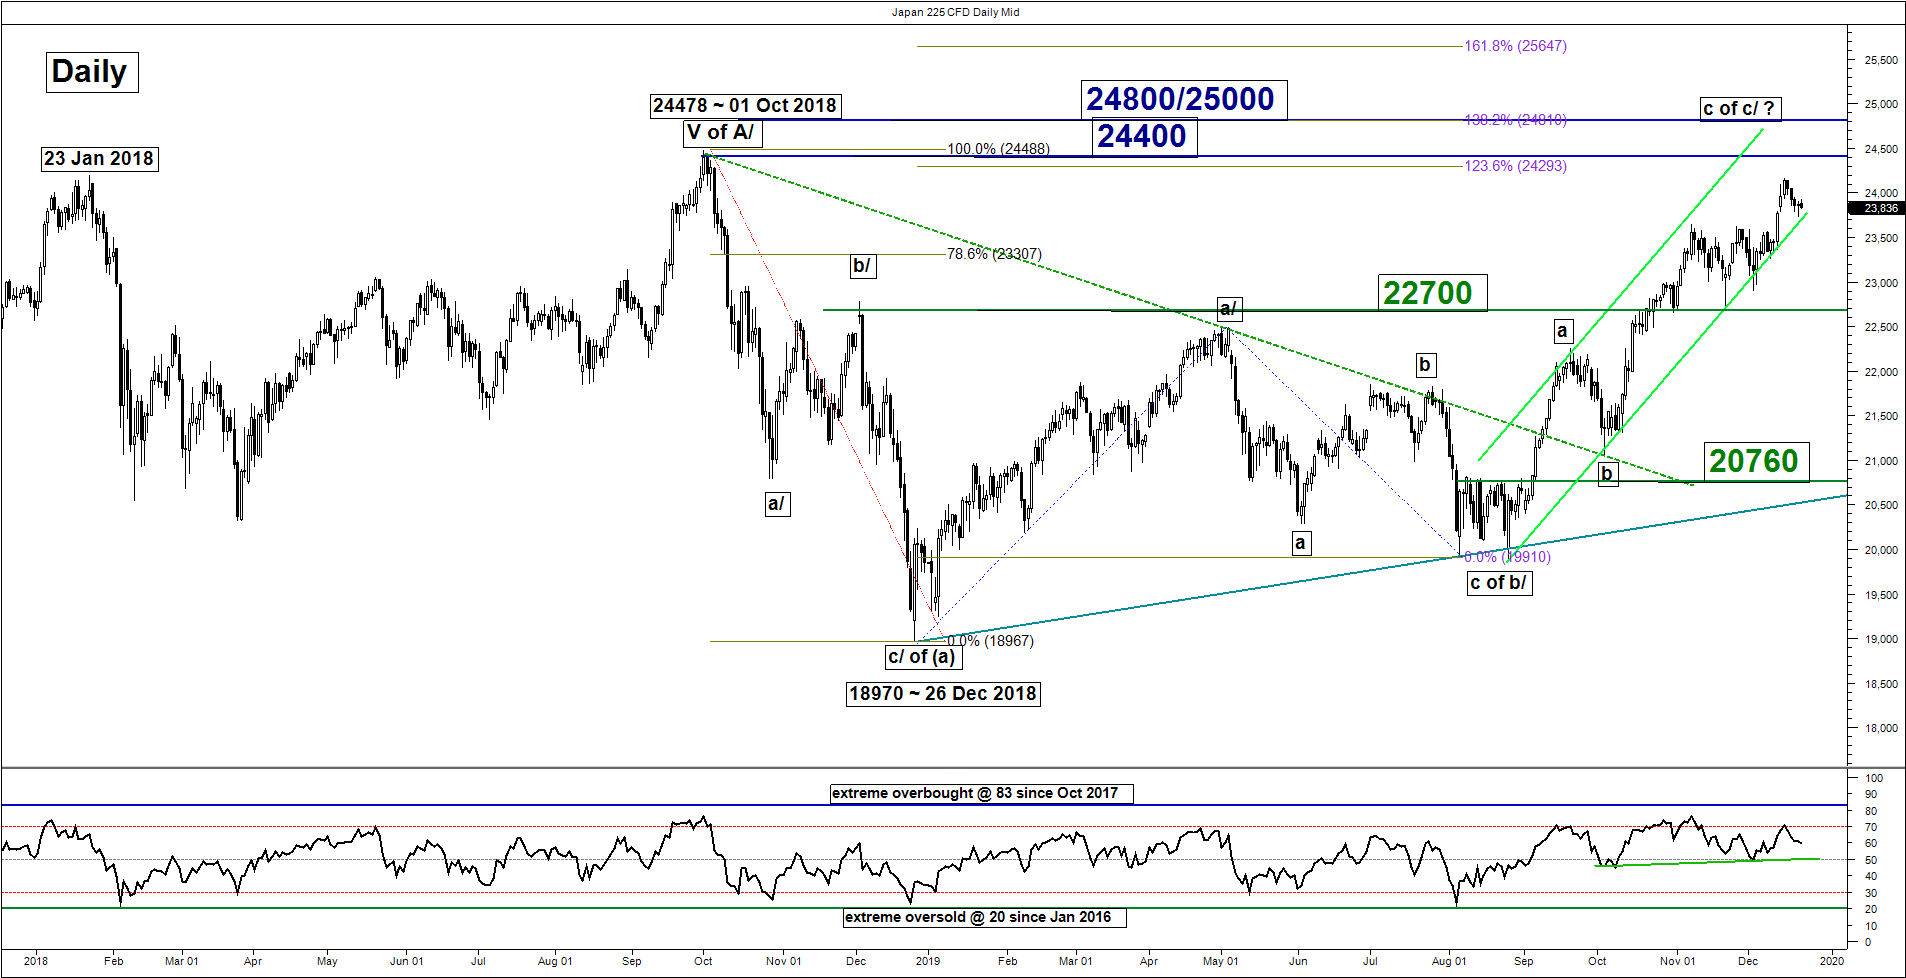
Last week, the Japan 225 Index (proxy for the Nikkei 225 futures) has pull-backed and remained above the 23540 key medium-term pivotal support. Maintain bullish bias for another round of potential push up to retest 01 Oct 2018 swing high area of 24400 before targeting 24800/2500 next.
On the other hand, a break with a daily close below 23540 negates the bullish tone for a deeper corrective slide to retest 22700 support (the former major range resistance of a sideway configuration from 26 Dec 2018/23 Oct 2019).
Hang Seng – Likely range bound between 28200 & 27100
click to enlarge charts
Key Levels (1 to 3 weeks)
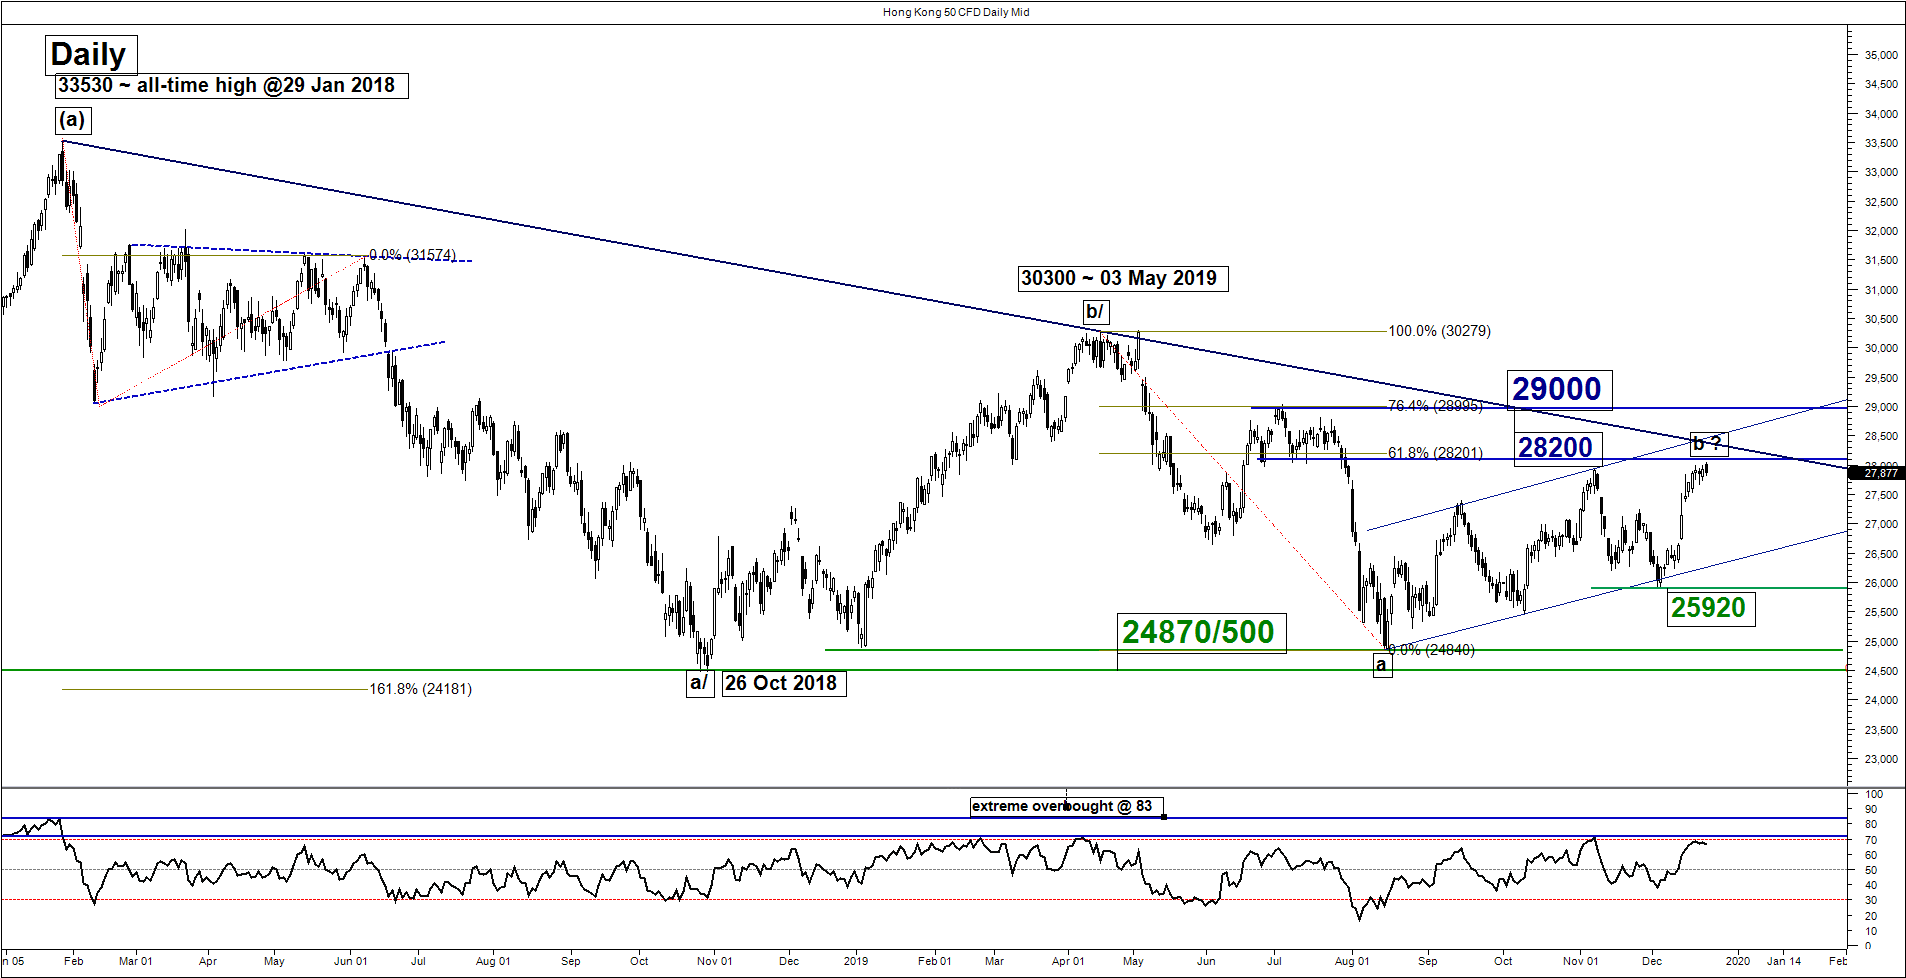
Resistances: 28200 & 29000
Supports: 27100 & 25920
Directional Bias (1 to 3 weeks)
Last week, the Hong Kong 50 Index (proxy for Hang Seng Index futures) has traded sideways below the 28200 upper limit of the medium-term neutrality range as per highlighted in our previous report.
No change, maintain neutral stance between 28200 and 27100 where bears need to have a break below 27100 to reinstates a potential slide to retest the 03 Dec 2019 swing low of 25920. On the flipside, a clearance with a daily close above 28200 sees a bullish breakout from the major descending trendline resistance in place since 29 Jan 2018 high to probe 29000 next (76.4% Fibonacci retracement of the previous down move from 03 May high to 15 Aug 2019 low & swing high area of 02/04 Jul 2019) in the first step.
ASX 200 – Bulls need to break above 6890
click to enlarge charts
Key Levels (1 to 3 weeks)
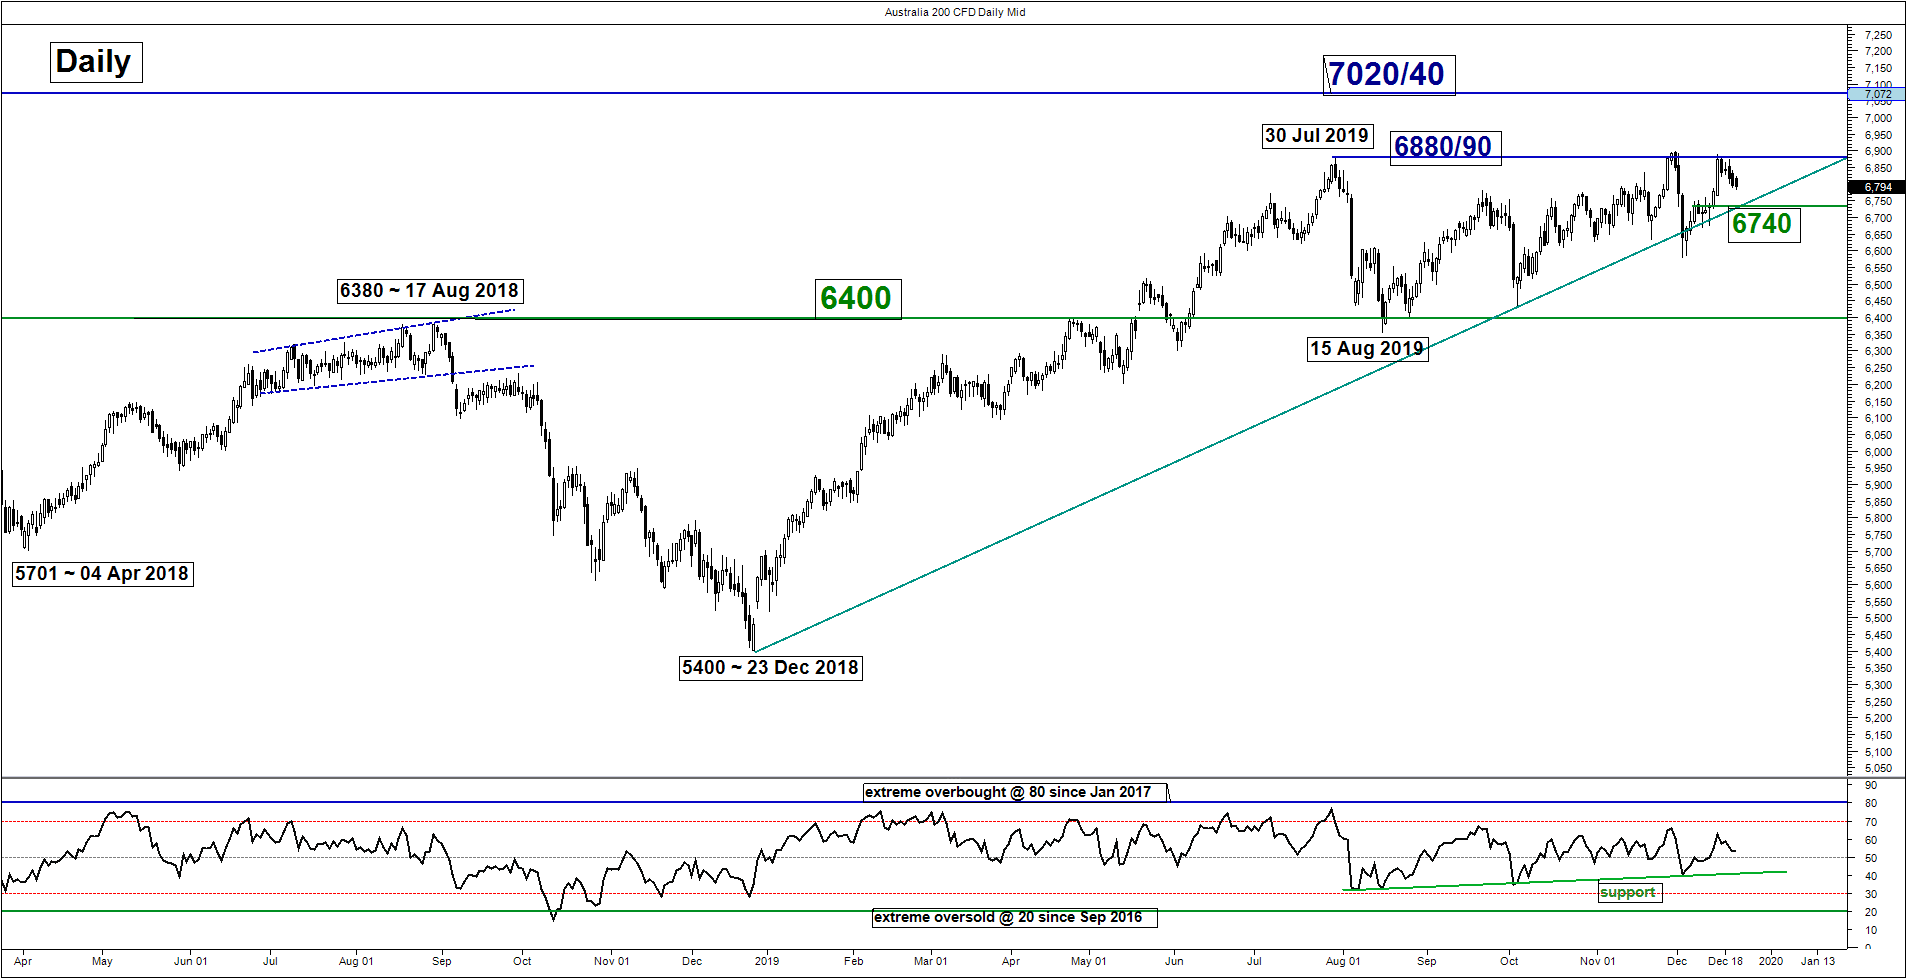
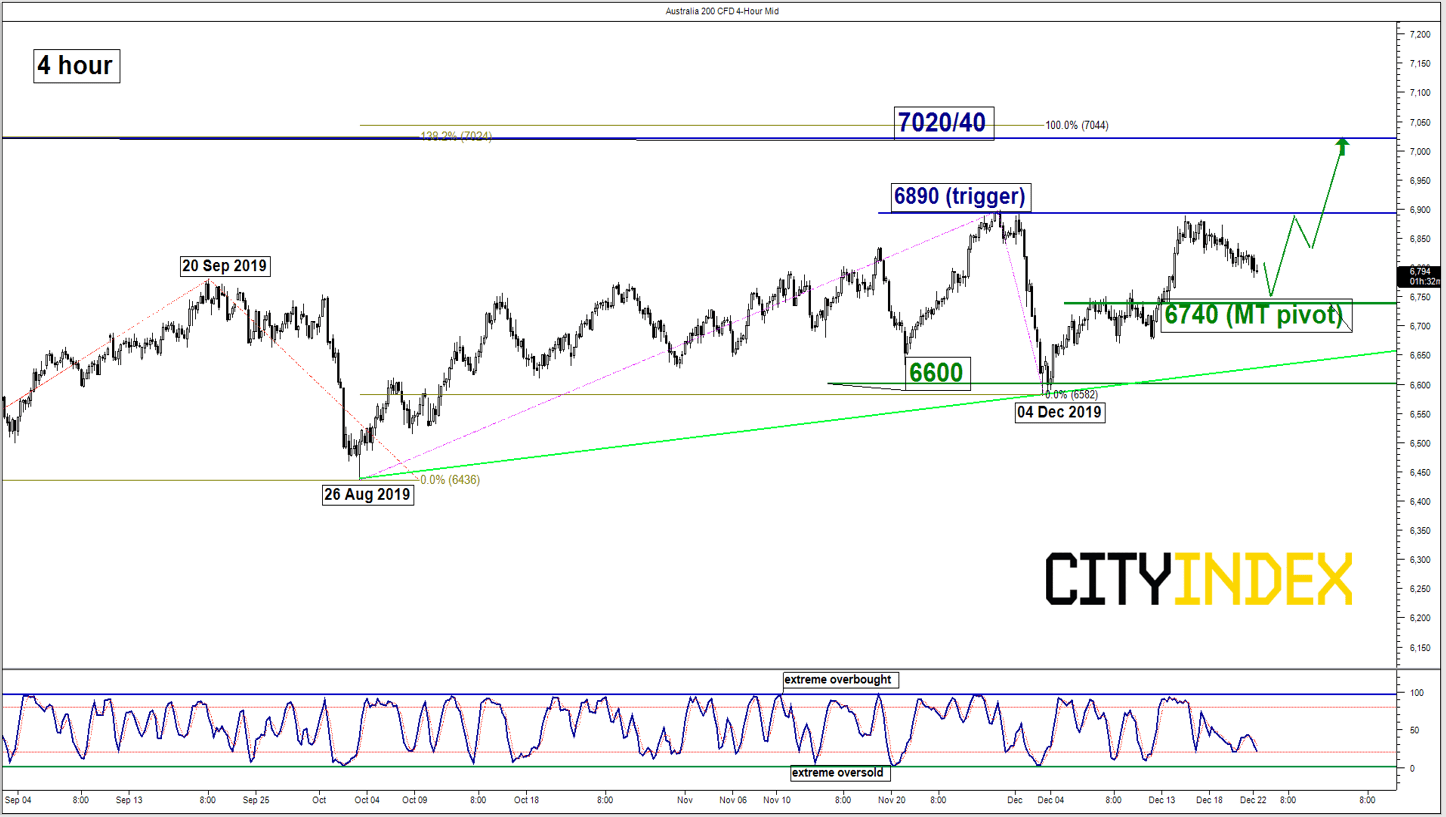
Pivot (key support): 6740
Resistances: 6890 & 7020/40
Next supports: 6600 & 6400
Directional Bias (1 to 3 weeks)
Last week, the Australia 200 Index (proxy for the ASX 200 futures) has staged the 3rd attempt since 30 Jul 2019 to break above 6880/90 (its current all-time high area). It failed and pull-backed by 1.40% to print a low of 6783 on last Fri, 23 Dec.
6740 remains the key medium-term pivotal support and bulls need to have a daily close above 6890 to trigger another potential impulsive upleg sequence to target the next resistance at 7020/40 in the first step.
On the other hand, a break with a daily close below 6740 invalidates the bullish scenario for a corrective decline towards 6600 and even 6400 next.
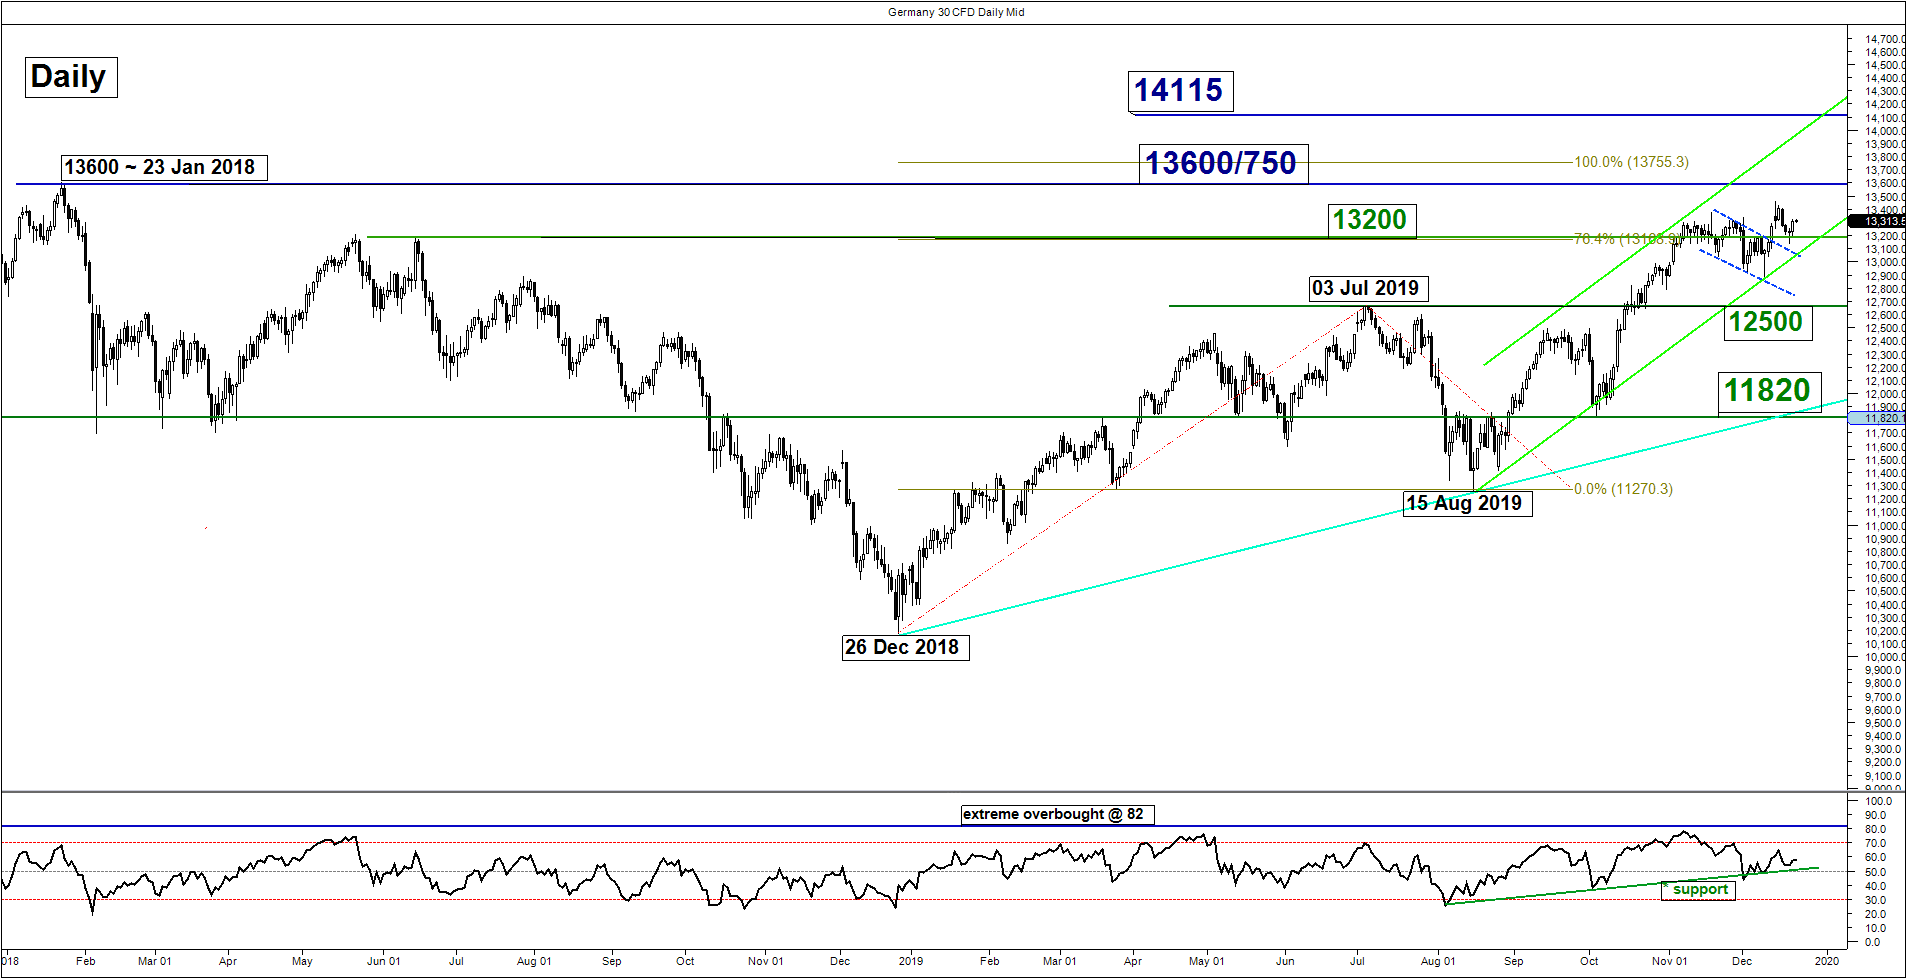
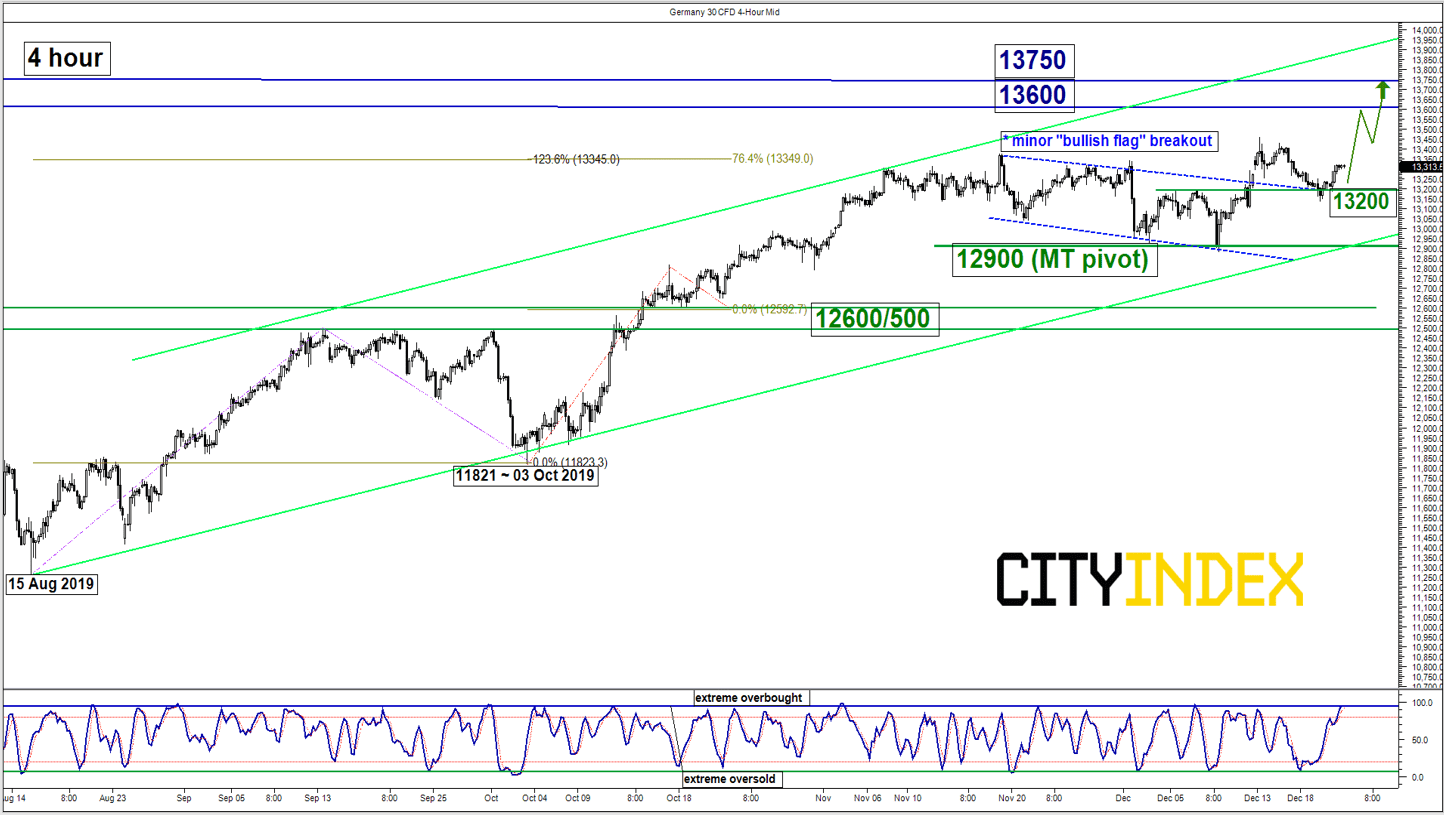
DAX – Rebounded from “Bullish Flag” pull-back support at 13200
click to enlarge charts
Key Levels (1 to 3 weeks)
Intermediate support: 13200
Pivot (key support): 12900
Resistances: 13600, 13750 & 14115
Next support: 12600/500
Directional Bias (1 to 3 weeks)
Last week, the Germany 30 Index (proxy for the DAX futures) has staged a pull-back of 2.30% from its 13 Dec high of 13458 to retest the 13200 pull-back support of the former “Bullish Flag” range configuration before it rebounded on last Fri, 20 Dec after it printed an intraday low of 13139 on 19 Dec.
Elements remain positive; maintain the bullish bias in any dips above the 12900 key medium-term pivotal support for a further potential push up to target 13600 (all-time high area) follow by 13750 (Fibonacci expansion cluster) next in the first step.
On the other hand, a break with a daily close below 12900 negates the bullish tone for a deeper corrective slide to retest the next support at 12600/500 (the former major swing high area of 03 Jul 2019) before another impulsive up move sequence unfolds.
Charts are from City Index Advantage TraderPro & eSignal
Latest market news
Today 08:15 AM
Latest Australia 200 articles
February 15, 2024 11:33 PM
February 15, 2024 01:42 AM
February 14, 2024 05:39 AM