


S&P 500 – Relentless uptrend intact
click to enlarge charts
Key Levels (1 to 3 weeks)
Pivot (key support): 3128
Resistances: 3200/220 & 3250
Next support: 3020
Directional Bias (1 to 3 weeks)
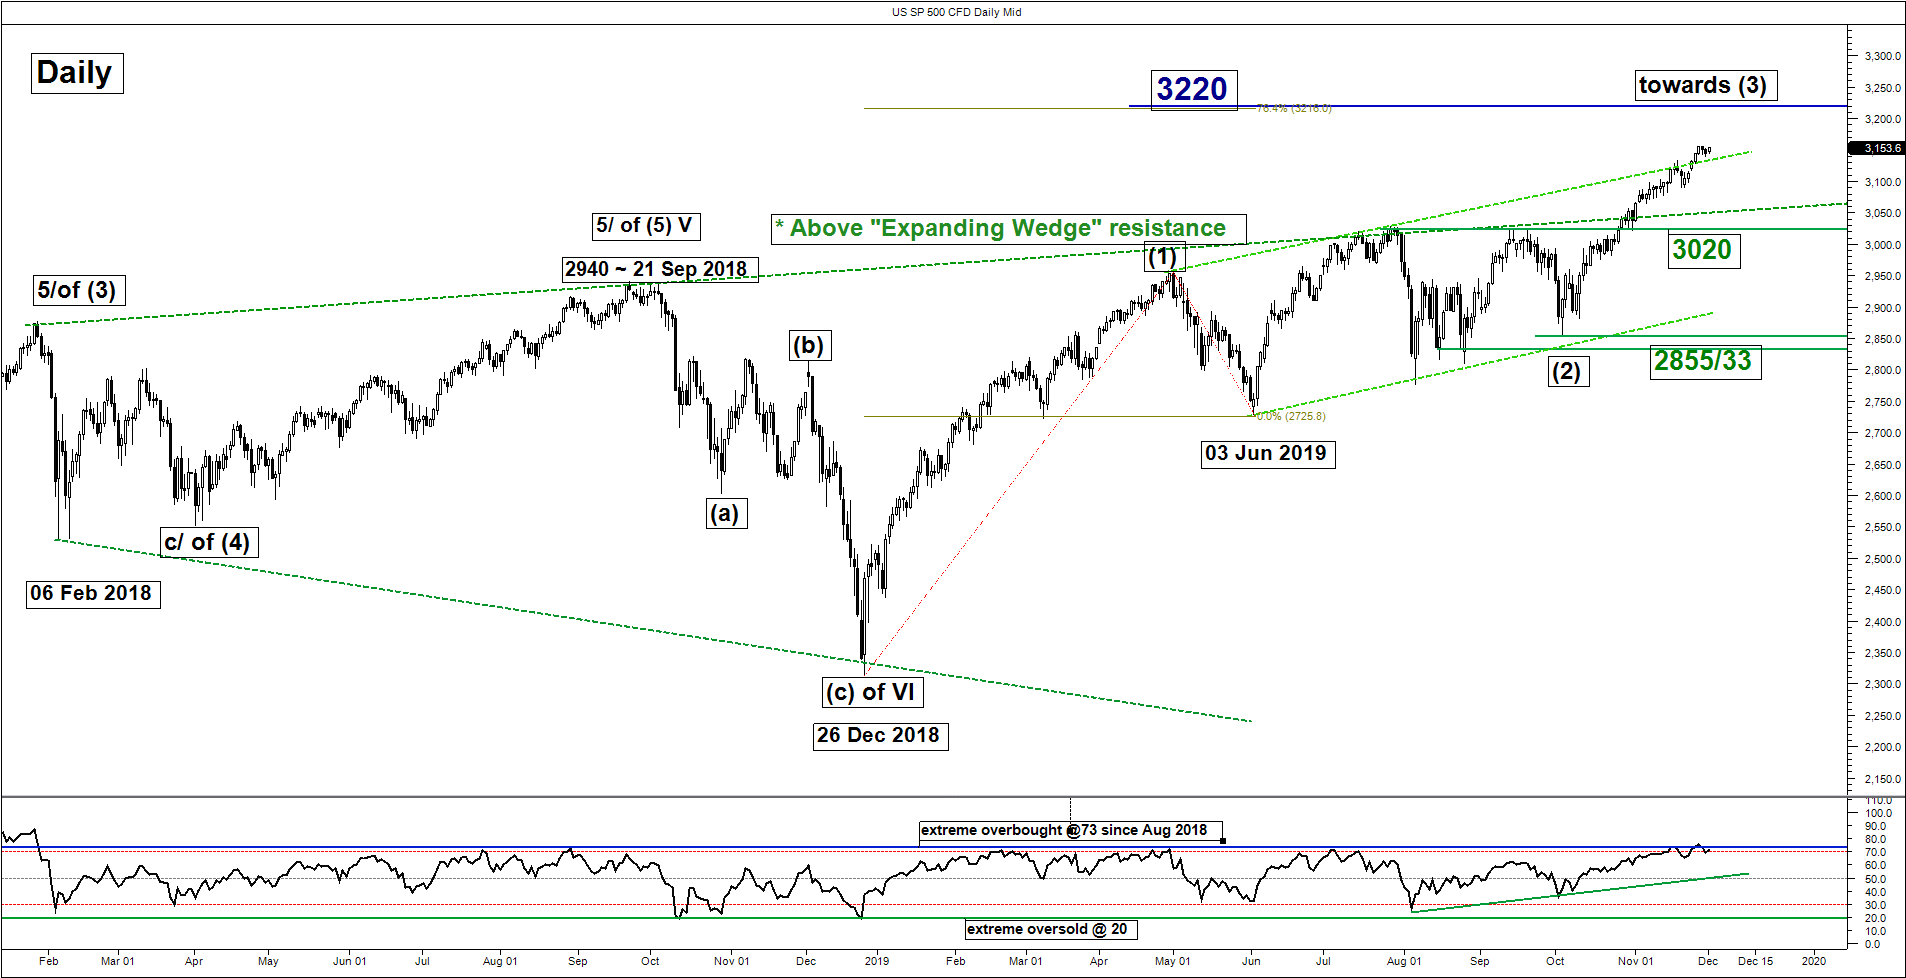
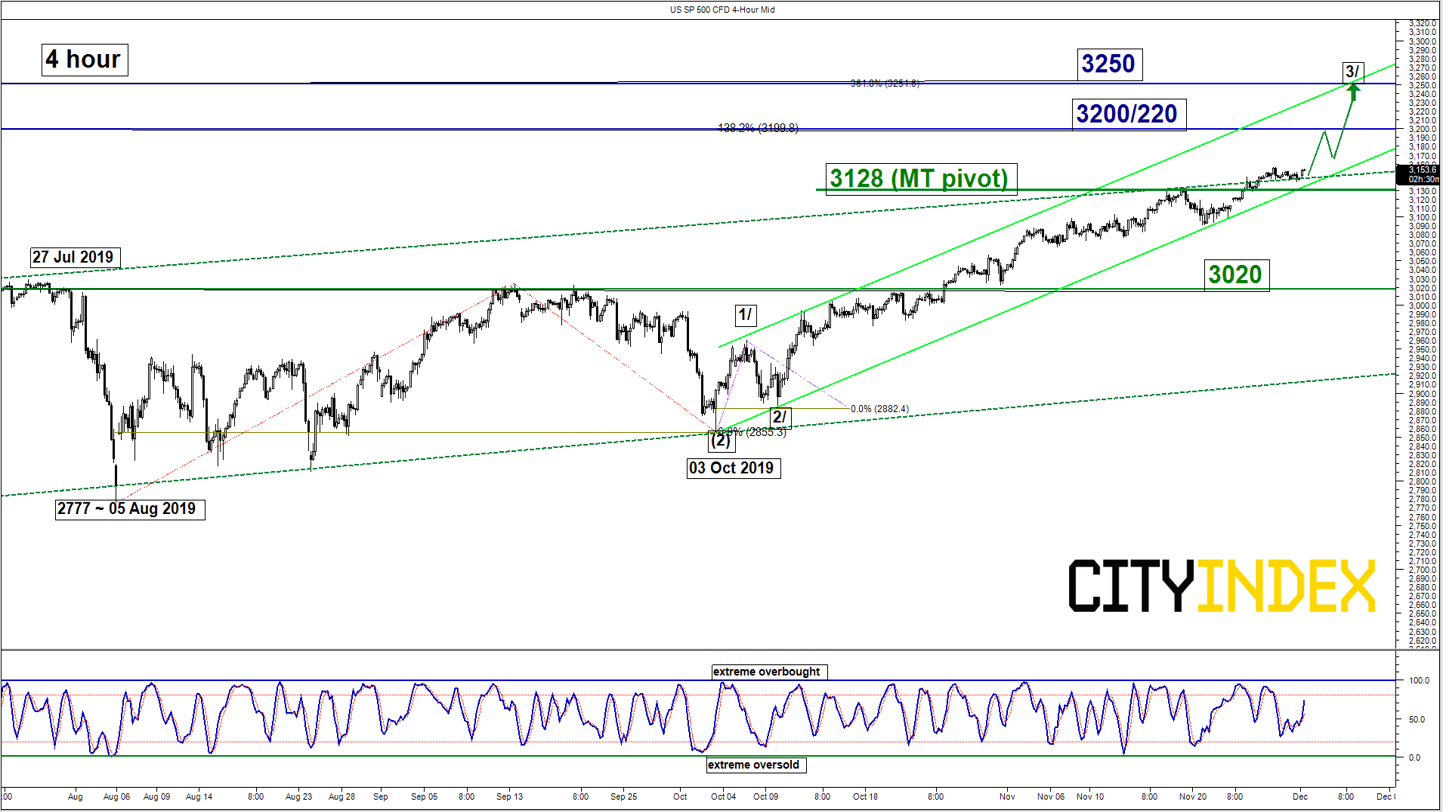
The SP 500 Index ((proxy for the S&P 500 futures) has broken above the 3132 excess medium-term pivotal resistance over a shorten Thanksgiving holiday week which has invalidated the multi-week corrective decline scenario as per highlighted in our previous report.
Flip back to a bullish bias in any dips above 3128 key medium-term pivotal support for a further potential impulsive up move to target the next resistance zone at 3200/220 in the first step before targeting 3250 next.
However, a break with a daily close below 3128 reinstates the corrective decline scenario towards the next support 3020 (the former range resistance of 26 Jul/13 Sep 2019 & the pull-back support of the former major “Expanding Wedge” resistance).
Key elements
- The 3128 key medium-term support is defined by intersection point of the pull-back support of a former ascending range resistance from 01 May 2019 high and the lower boundary of an ascending channel from 03 Oct 2019 low.
- The daily RSI oscillator has continued to hover at its overbought region but without any bearish divergence signal which indicates that medium-term upside momentum remains intact.
- The 3200/220 and 3250 resistances are defined by Fibonacci expansion clusters and the upper boundary of an ascending channel from 03 Oct 2019 low.
Nikkei 225 – Potential bullish breakout above 23650
click to enlarge charts
Key Levels (1 to 3 weeks)
Intermediate support: 23200
Pivot (key support): 22700
Resistances: 23650, 24400 & 24800/25000
Next supports: 22170 & 21300
Directional Bias (1 to 3 weeks)
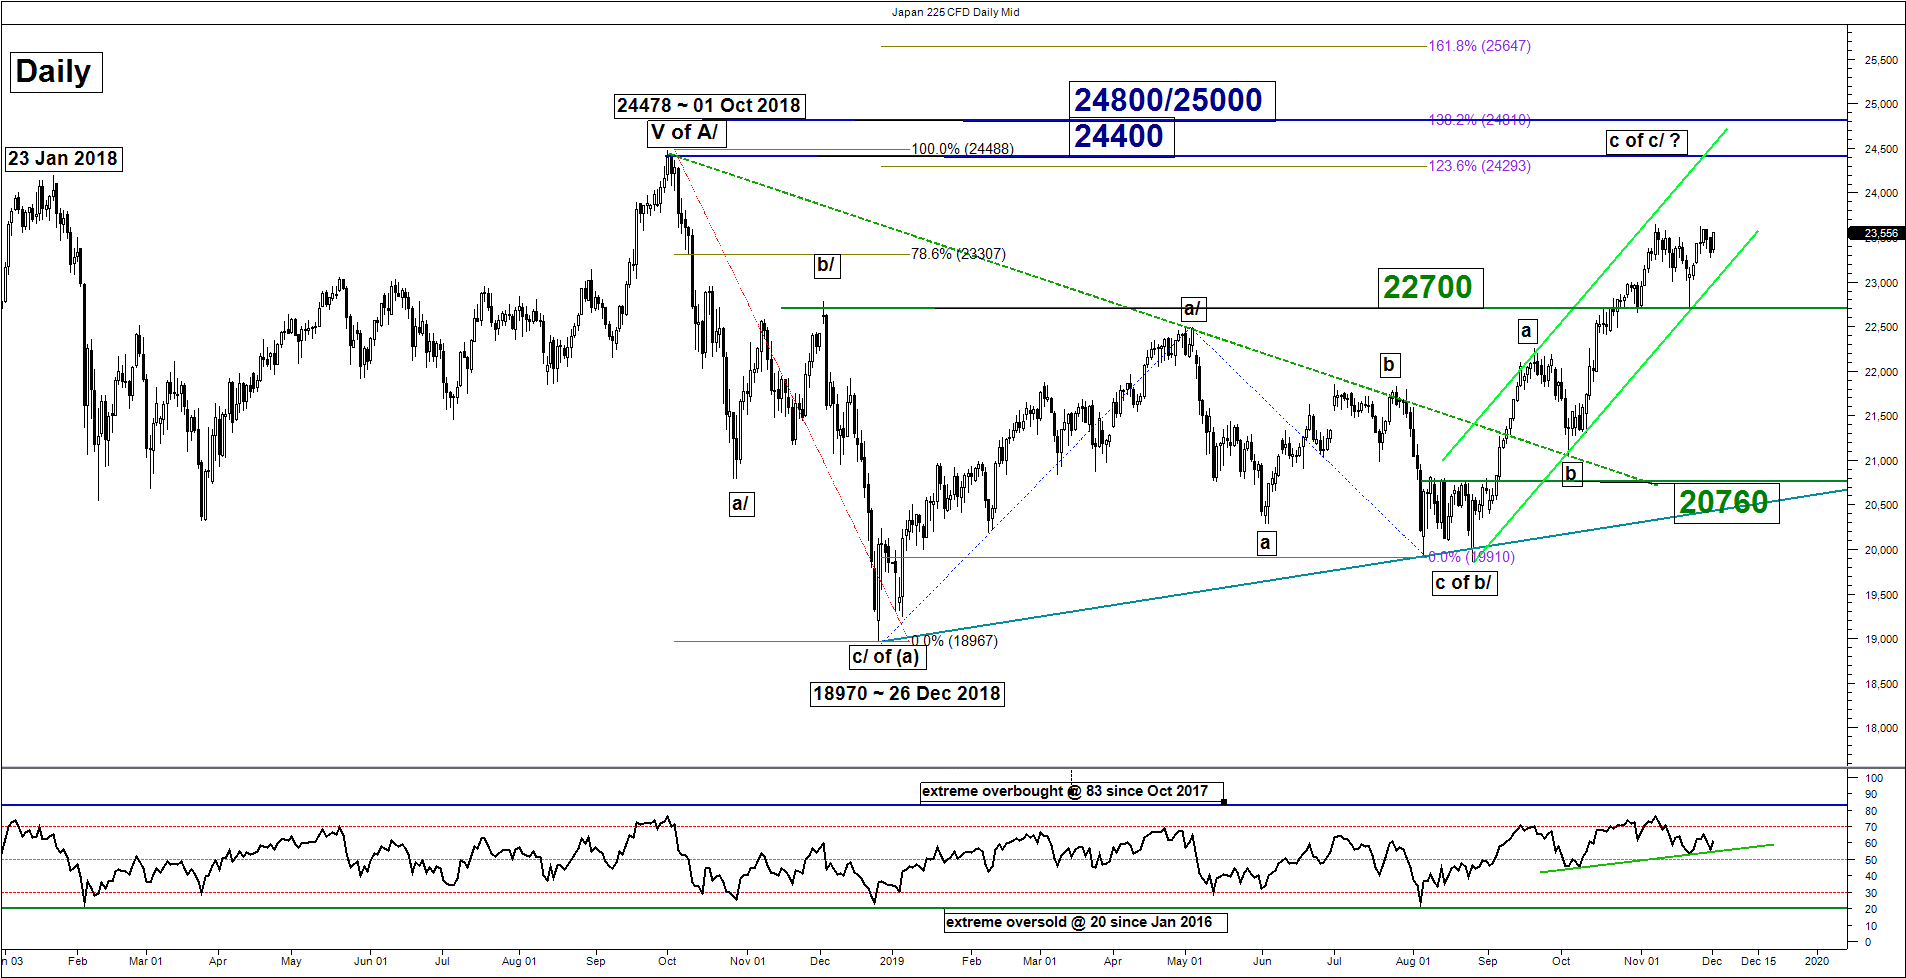
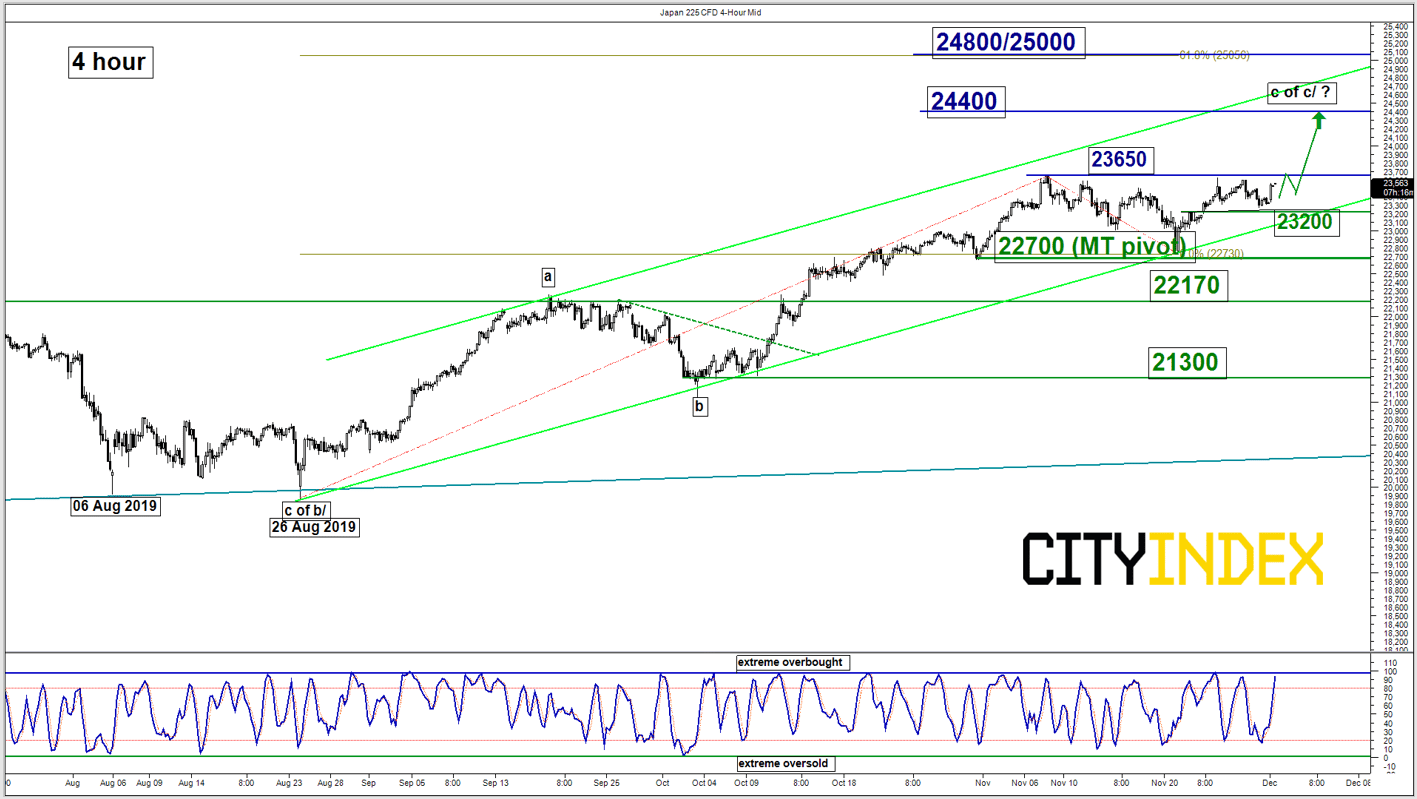
The Japan 225 Index (proxy for the Nikkei 225 futures) has traded sideways below the recent range resistance of 23650 in place since 07 Nov 2019 with the daily RSI oscillator that has started to turn bullish above its corresponding ascending support at the 55 level. These observations suggest a revival of medium-term upside momentum of price action.
Flip to a bullish bias in any dips above 22700 key medium-term pivotal resistance for a potential breakout above the 23650 range resistance to target the next resistance at 24400 in the first step.
However, a break with a daily close below 22700 invalidates the bullish tone to reinstate the multi-corrective decline scenario towards the next supports at 22170 and even 21300 next (the swing low area of 04 Oct 2019 & the 61.8% Fibonacci retracement of the up move from 26 Aug low to 07 Nov 2019 high).
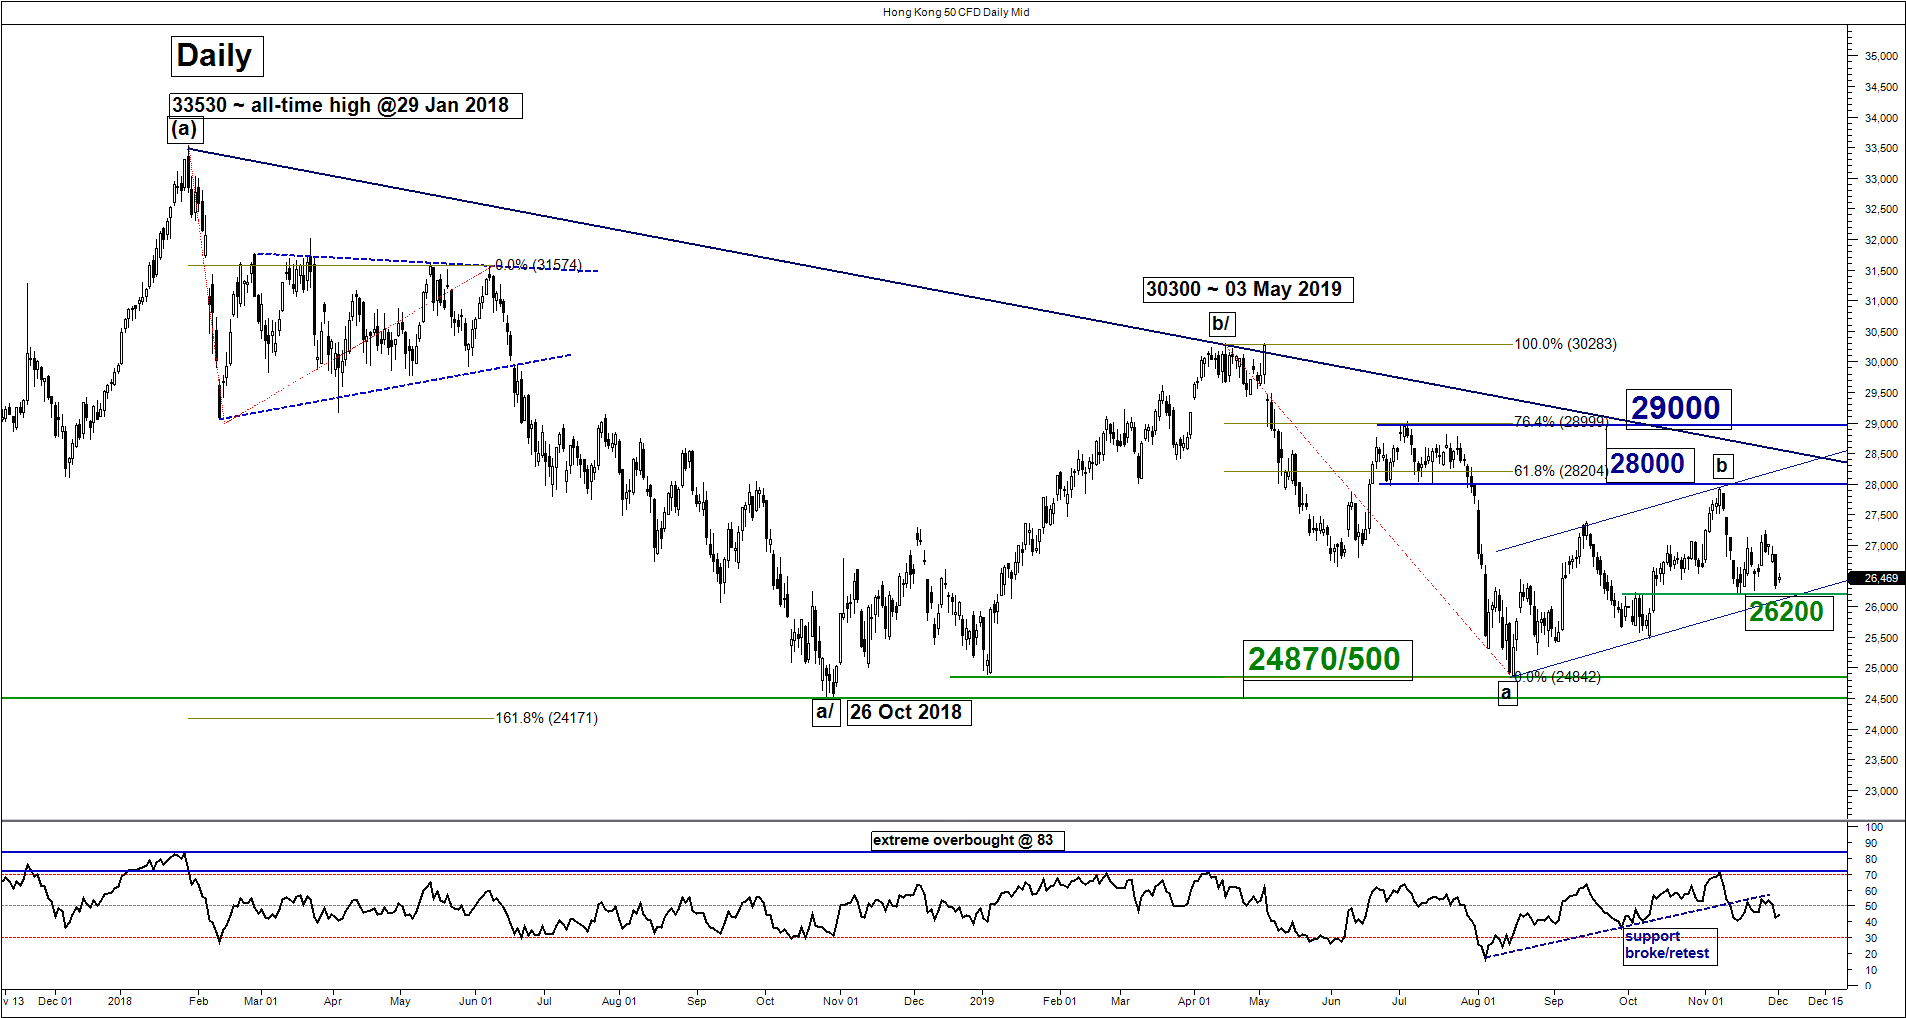
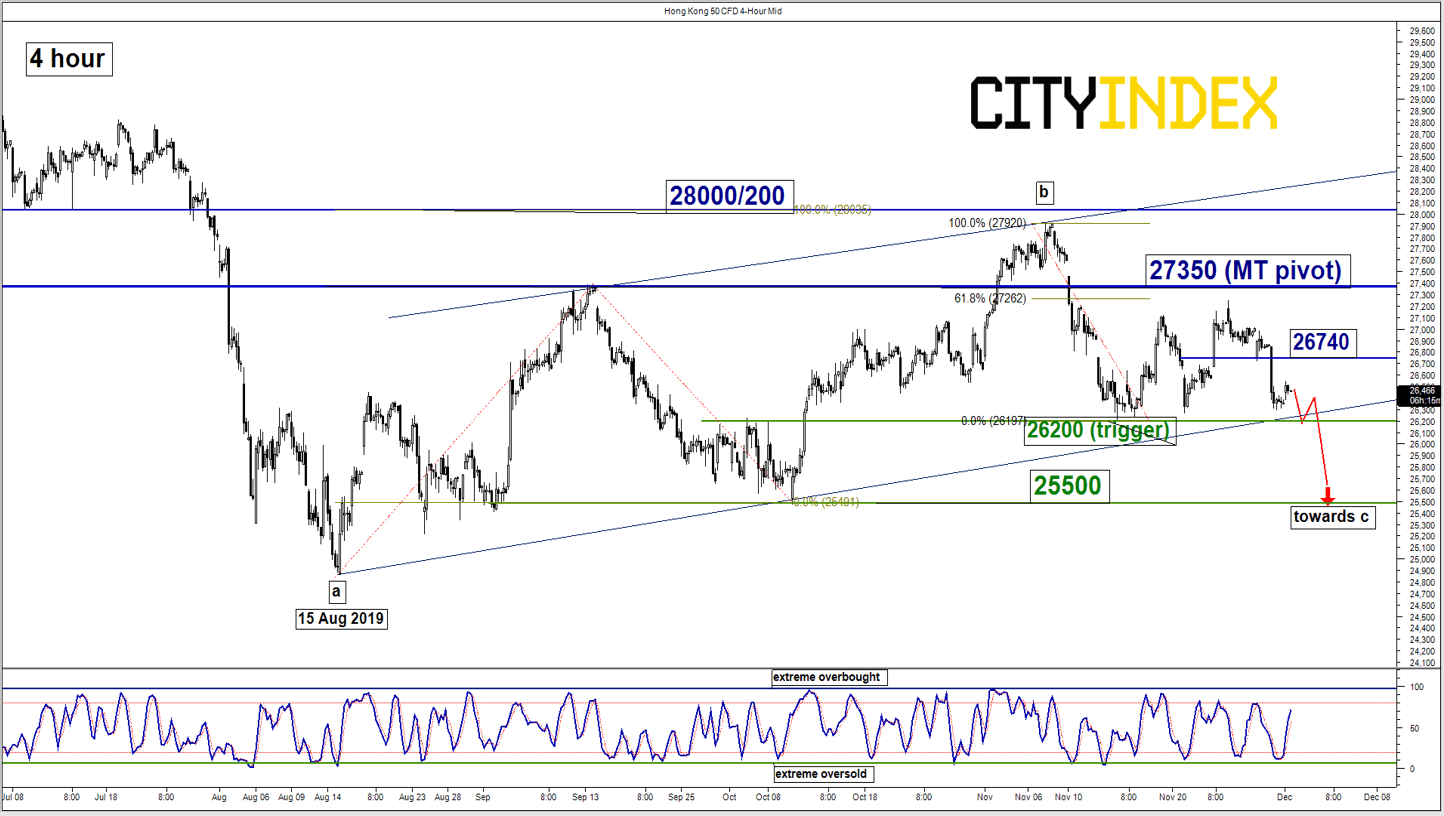
Hang Seng – Bears need to break below 26200
click to enlarge charts
Key Levels (1 to 3 weeks)
Intermediate resistance: 26740
Pivot (key resistance): 27350
Support: 26200 (trigger) & 25500
Next resistance: 28000/200
Directional Bias (1 to 3 weeks)
The Hong Kong 50 Index (proxy for Hang Seng Index futures) has staged to expected slide towards the 26200 downside trigger level on last Fri, 29 Nov (the ascending range support from 15 Aug 2019). It has printed an intraday low of 26300 before it staged a rebound of 0.90% to record a current intraday high of 26546 in today, 02 Dec Asian session.
No major changes on its key elements; maintain the bearish bias in any bounces within a major sideways range configuration in place since 26 Oct 2019 low. 27350 key medium-term pivotal resistance and a break below 26200 sees a further potential slide to target the next support at 25500 (10 Oct 2019 swing low & 76.4% Fibonacci retracement of the up move from 15 Aug low to 07 Nov 2019 high).
However, a clearance with a daily close above 27350 negates the bearish tone for a push up to retest 28000/28200 (upper boundary of the ascending range in place since 15 Aug 2019 low & the 61.8% Fibonacci retracement of the previous decline from 03 May high to 15 Aug 2019 low).
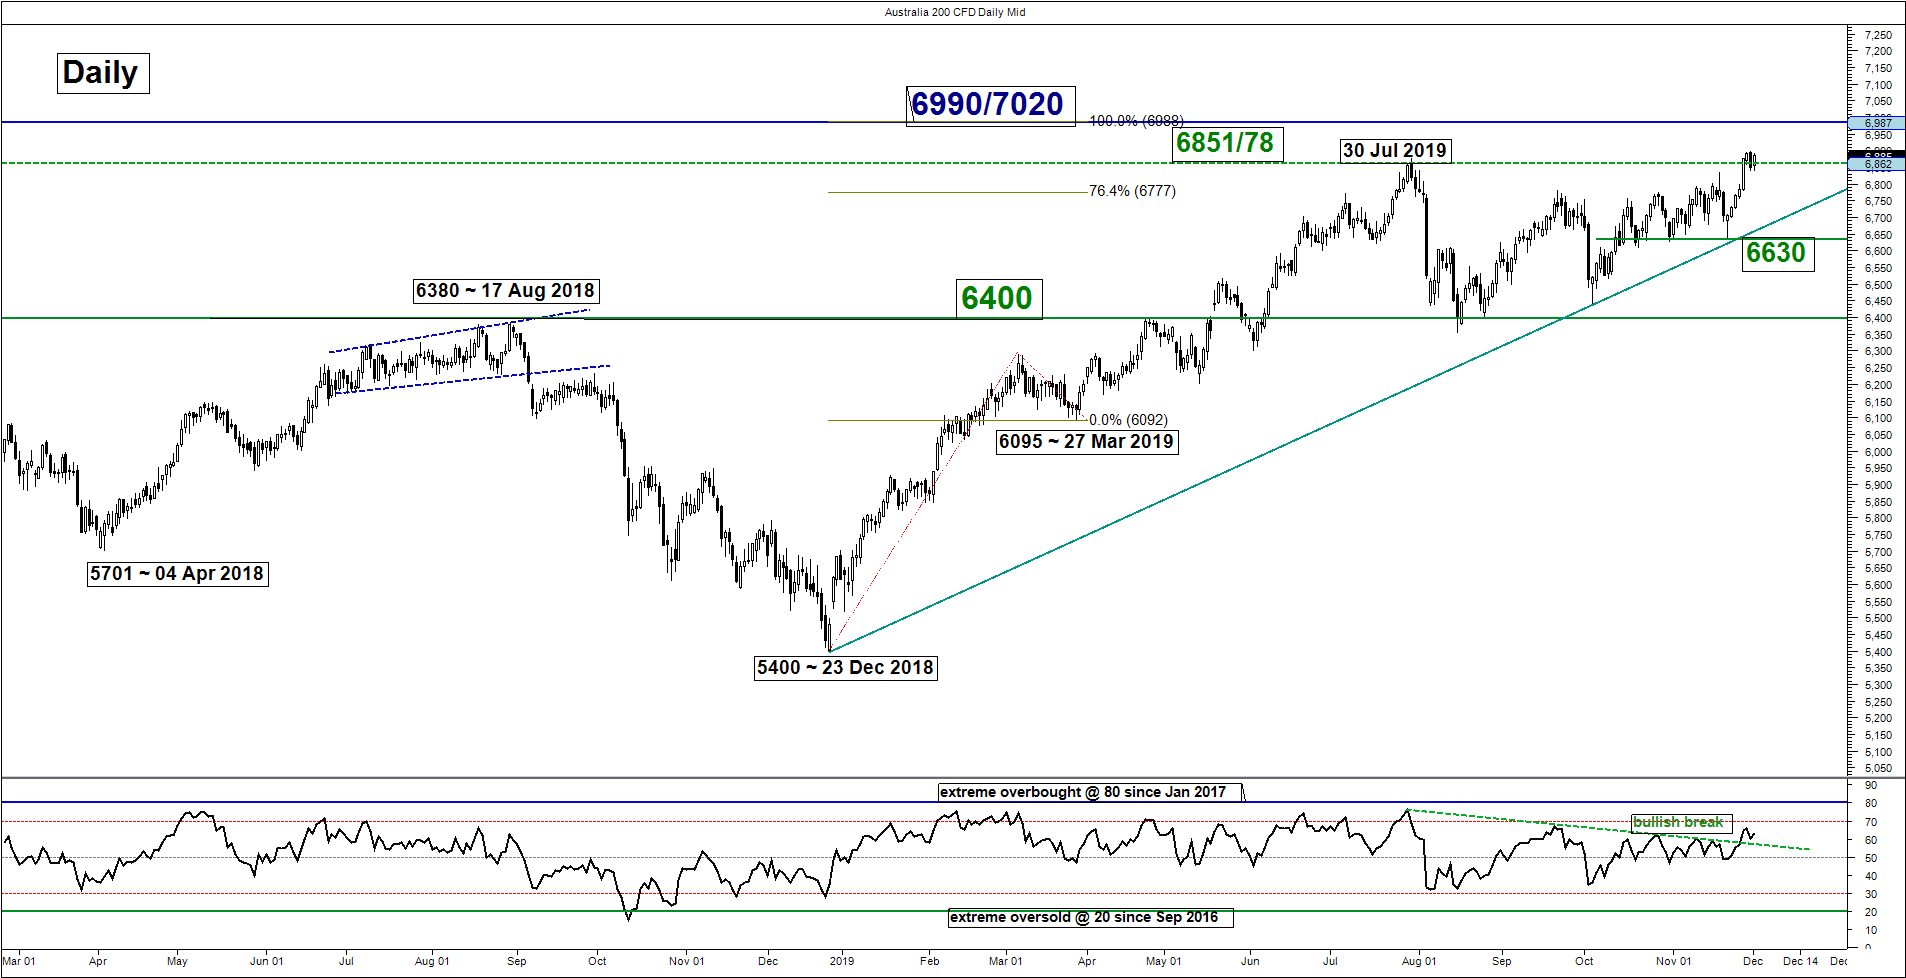
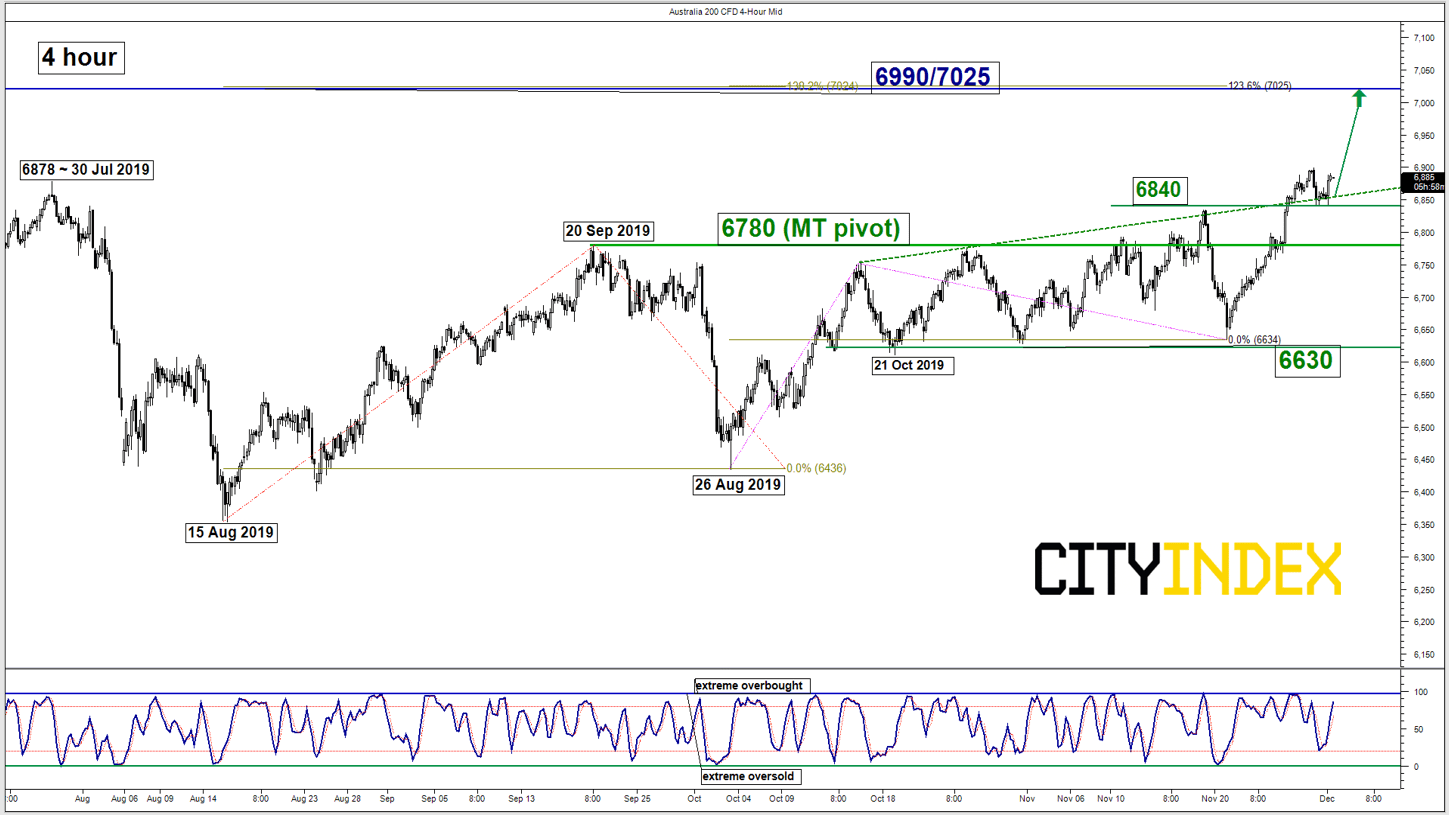
ASX 200 – Bullish break above previous all-time high
click to enlarge charts
Key Levels (1 to 3 weeks)
Intermediate support: 6840
Pivot (key support): 6780
Resistances: 6690 & 7025
Next support: 6630
Directional Bias (1 to 3 weeks)
The Australia 200 (proxy for the ASX 200 futures) has staged a bullish breakout above the 6851 previous all-time high printed in Oct 2007 on the back drop of a dovish RBA governor speech last week that has invalidated the multi-week corrective decline scenario.
Flip to a bullish bias in any dips above 6780 key medium-term pivotal support for a further potential push up to target the next resistances at 6690 and 7025 (Fibonacci expansion cluster). However, a break with a daily close below 6780 reinstates the multi-week corrective decline towards the next support at 6630 (the range support from 21 Oct/21 Nov 2019 & the major ascending trendline from 23 Dec 2018 low).
Key elements
- The daily RSI oscillator remains positive after a retest of its of its former corresponding descending resistance at the 59 level. This observation suggests a revival of medium-term upside momentum of price action.
- The 6780 key medium-term support is defined by the former range resistance from 20 Sep/19 Nov 2019 and the 38.2% Fibonacci retracement of the recent up move from 21 Nov low to 29 Nov 2019 high.
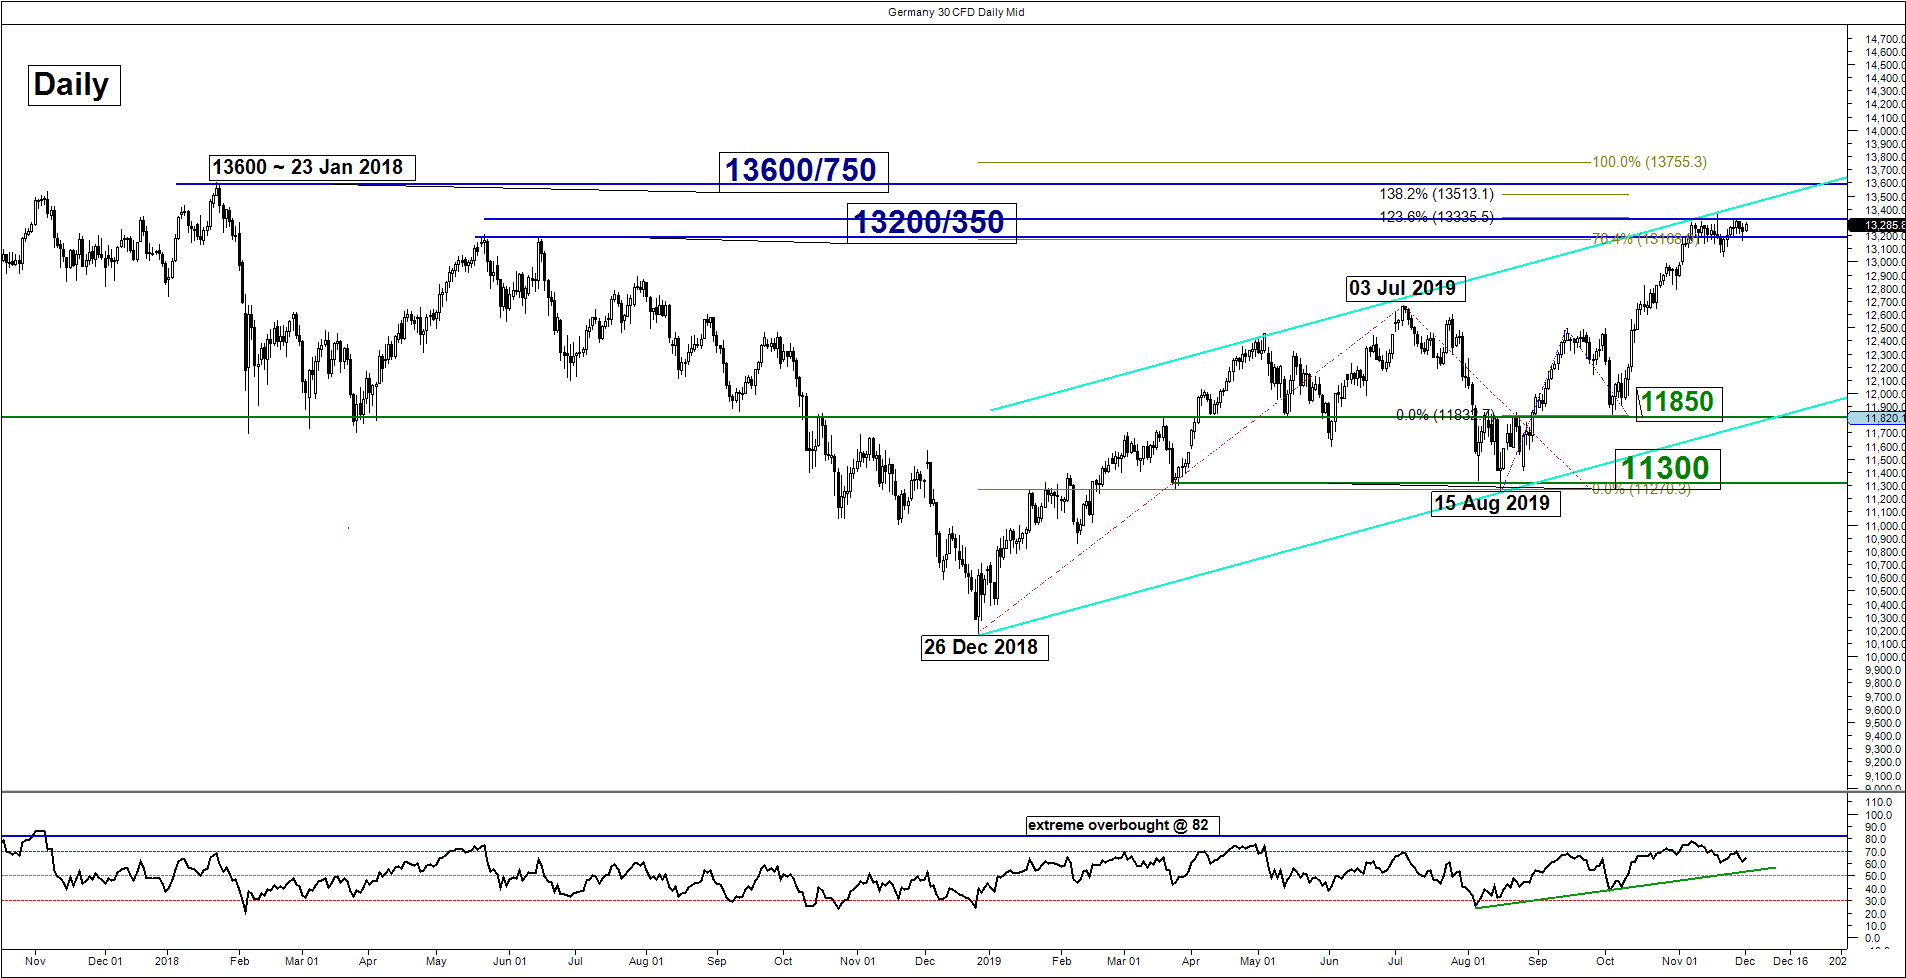
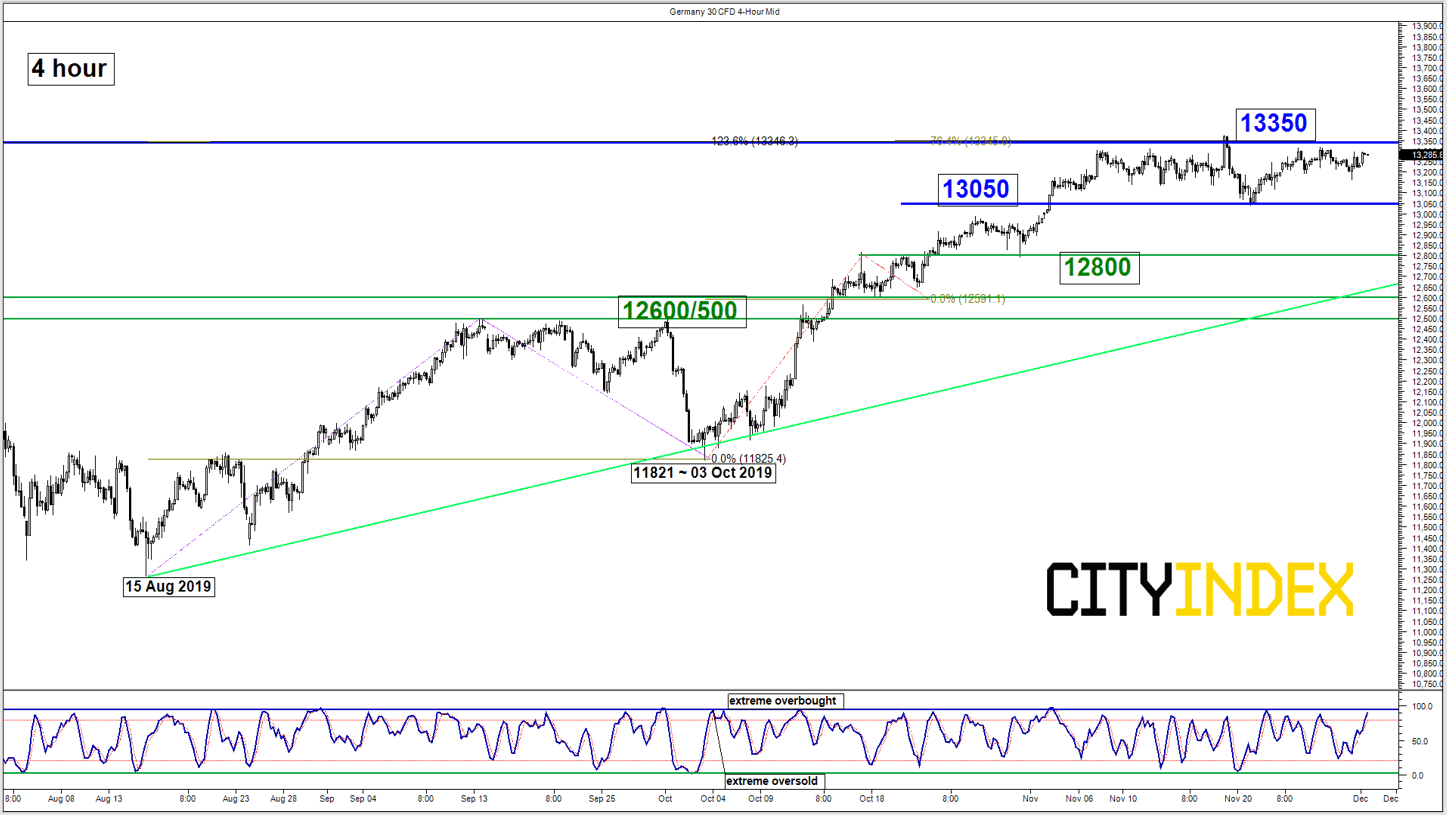
DAX – Turn neutral, watch the 13350 resistance
click to enlarge charts
Key Levels (1 to 3 weeks)
Resistances: 13350 & 13600/750 (all-time high)
Supports: 13050, 12800 & 12600/500
Directional Bias (1 to 3 weeks)
Given that the key benchmark U.S. stock indices are trading in an uptrending phase without any clear signs of bullish exhaustion, the conviction for a multi-week corrective decline for the Germany 30 Index (proxy for the DAX futures) has been reduced.
Prefer to turn neutral now between 13350 and 13050. Bears need to have a daily close below 13050 to unleash a potential corrective decline to target the next supports at 12800 and 12600/500 (the former swing high areas of 03 Jul/25 Jul 2019 & ascending trendline from 15 Aug 2019 low).
On the flipside, a clearance above 13350 sees a further squeeze up to retest the current all-time high level of 13600/750 (also a Fibonacci expansion cluster).
Charts are from City Index Advantage TraderPro
Latest market news
Yesterday 03:00 PM
Yesterday 01:12 PM
Yesterday 11:14 AM
Latest Australia 200 articles
February 15, 2024 11:33 PM
February 15, 2024 01:42 AM
February 14, 2024 05:39 AM