


S&P 500 – Whipsawed but medium-term uptrend remains intact
click to enlarge charts
Key Levels (1 to 3 weeks)
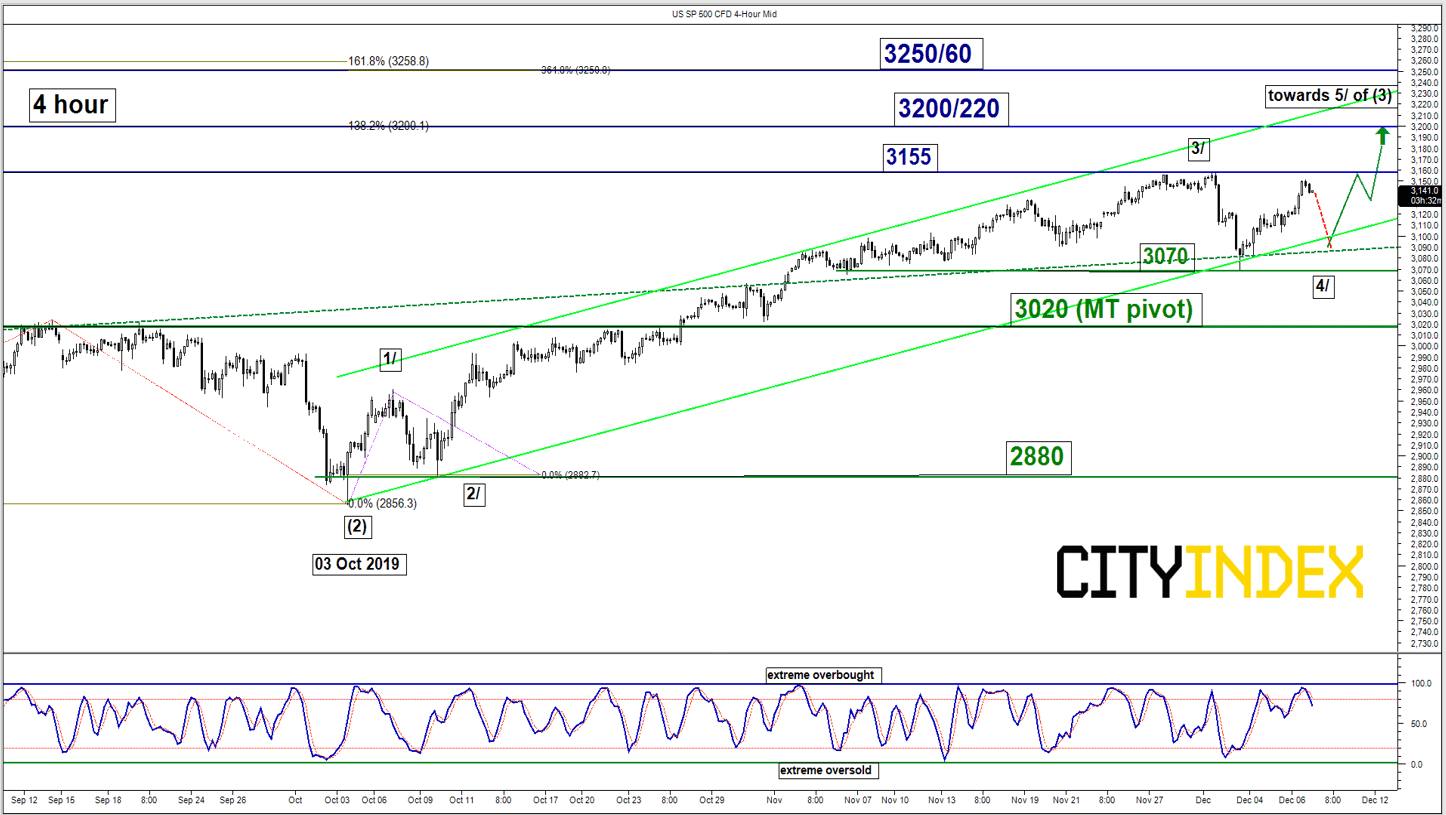
Intermediate support: 3070
Pivot (key support): 3020
Resistances: 3155, 3200/220 & 3250
Next support: 2880
Directional Bias (1 to 3 weeks)
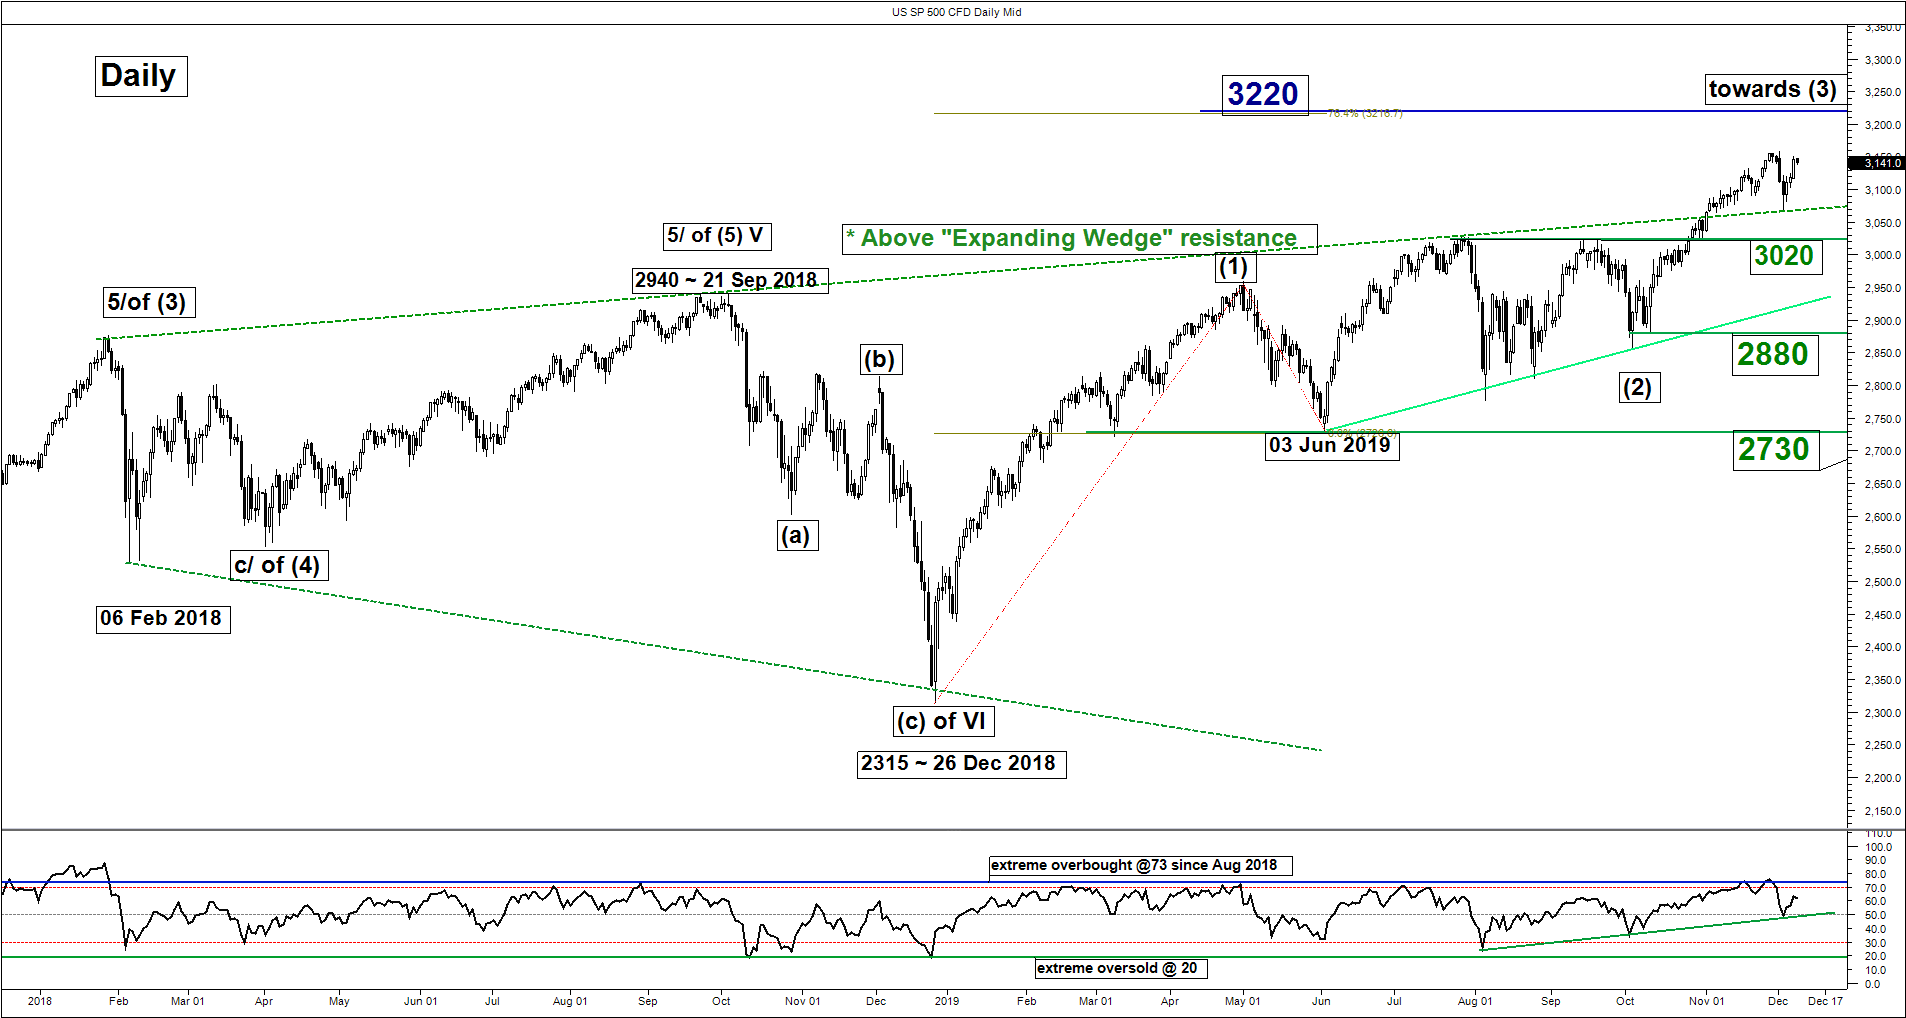
Last week, the SP 500 Index ((proxy for the S&P 500 futures) has whipsawed where it broke below the 3128 support in the first half of the week and rallied sharply towards the end of the week on the backdrop of drop of conflicting U.S-China trade related news flow a better than expected U.S. jobs data (NFP) for Oct. By the end of last Fri, 06 Dec U.S. session, it has almost recouped its earlier losses and just 0.4% away from its current all-time high level of 3158. Click here for a recap on our previous report.
No change, maintain bullish bias but with a wider key medium-term pivotal support at 3020 (to take into account of an increase in volatility due to trade driven headlines) for a potential push up to retest 3155 and a break above it reinforces the impulsive up move sequence to target the next resistance at 3200/220 in the first step.
On other hand, a break with a daily close below 3020 invalidates the multi-term uptrend for a multi-week corrective decline towards the next support at 2880 (ascending trendline from 03 Jun 2019 low & 61.8% Fibonacci retracement of the up move from 03 Jun low to 02 Dec 2019 high).
Key elements
- Last week’s 2.7% drop in price action has managed to stall at the 3070, the pull-back support of the former major “Expanding Wedge” resistance from 29 Jan 2018 high coupled with the daily RSI oscillator that has managed to bounce off from its corresponding ascending support at the 50 level. These observations suggest that medium-term upside momentum remain intact.
- Despite last week’s drop, the Index is still evolving within a medium-term ascending channel in place since 03 Oct 2019 low (see 4-hour chart).
- The 3200/220 resistance is defined the upper boundary of the medium-term ascending channel and a Fibonacci expansion cluster.
Nikkei 225 – Consolidation before potential bullish breakout
click to enlarge charts
Key Levels (1 to 3 weeks)
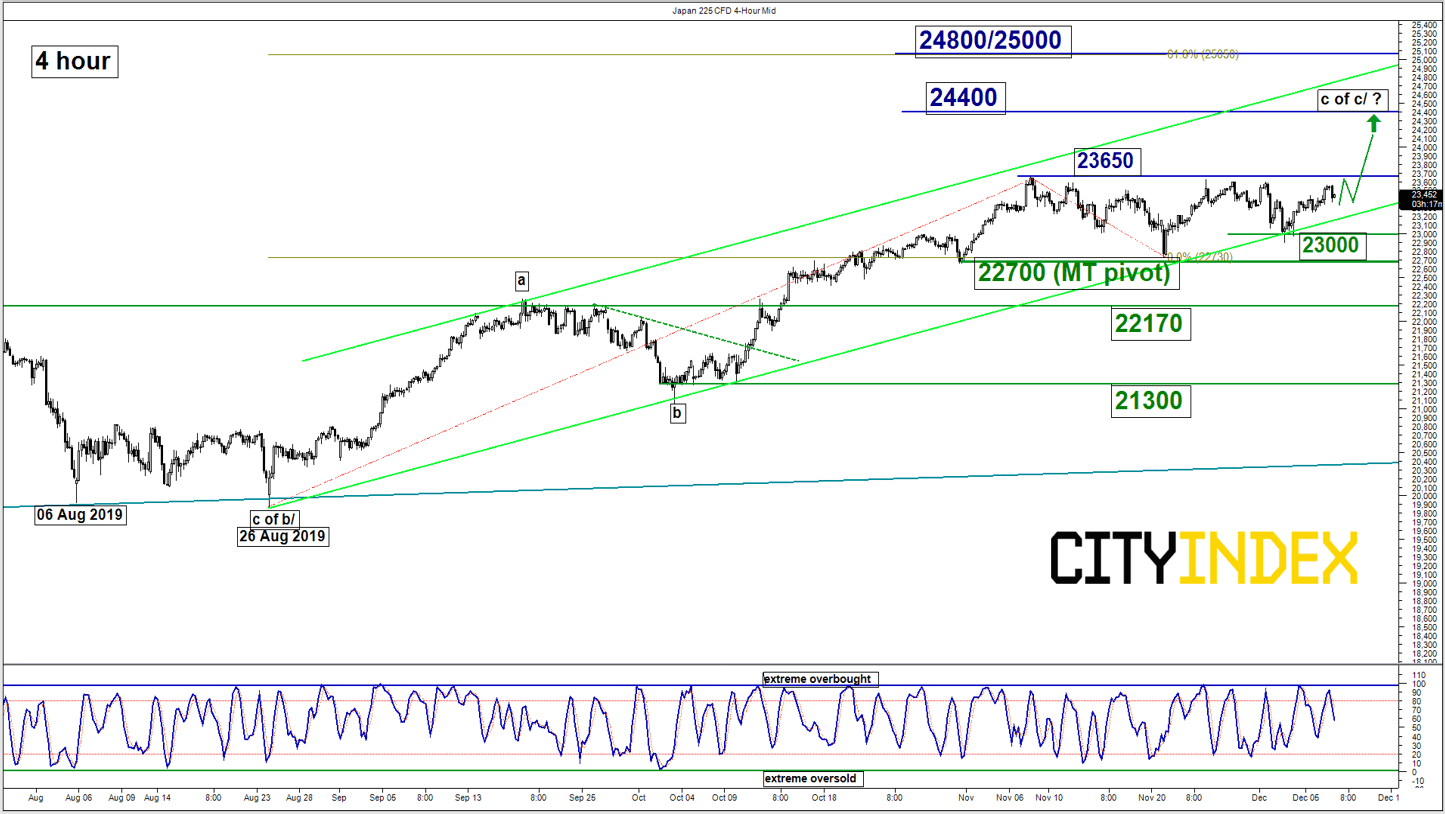
Intermediate support: 23000
Pivot (key support): 22700
Resistances: 23650, 24400 & 24800/25000
Next supports: 22170 & 21300
Directional Bias (1 to 3 weeks)
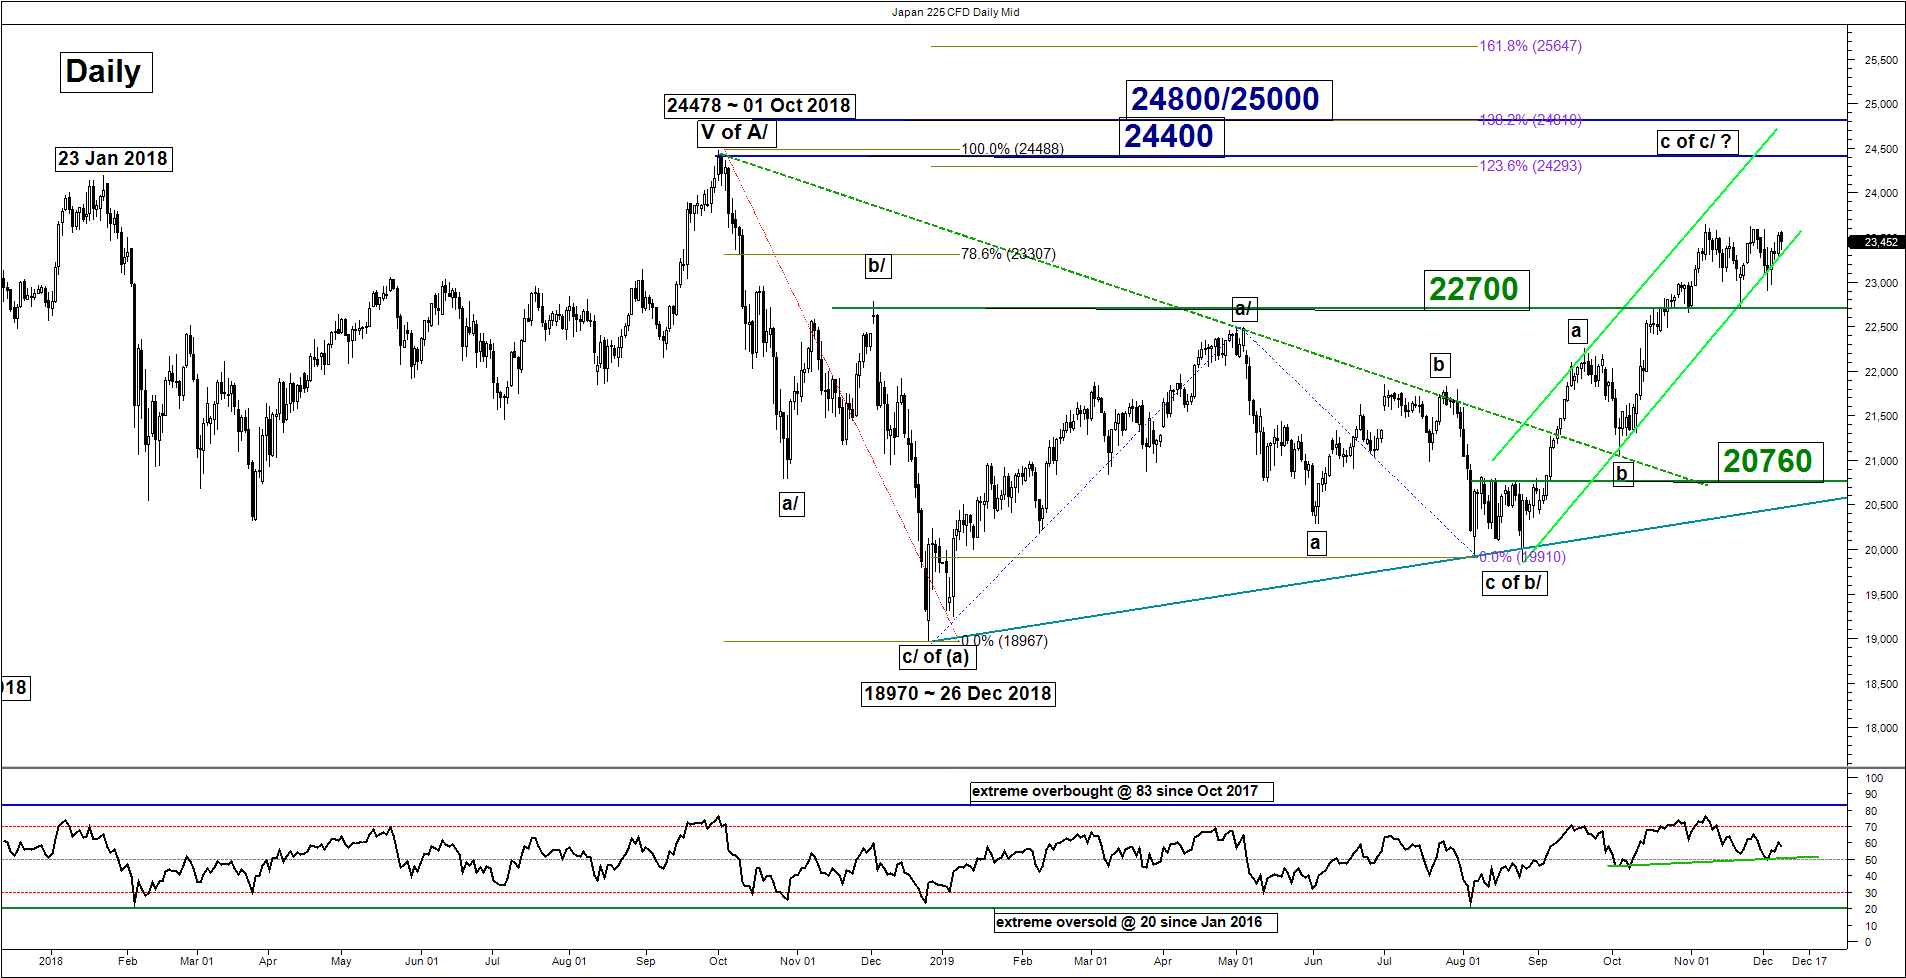
Last week’s drop of 2.7% seen in the Japan 225 Index (proxy for the Nikkei 225 futures) has managed to find support at the lower boundary of the medium-term ascending channel in place since 26 Aug 2019 low.
Maintain bullish bias in any dips above the 22700 key medium-term pivotal support and a break above 23650 reinforces the start of a potential multi-week up move to target the next resistance at 24400 in the first step.
On the other hand, a break with a daily close below 22700 invalidates the bullish tone to reinstate the multi-corrective decline scenario towards the next supports at 22170 and even 21300 next (the swing low area of 04 Oct 2019 & the 61.8% Fibonacci retracement of the up move from 26 Aug low to 07 Nov 2019 high).
Hang Seng – Potential push down to retest range support
click to enlarge charts
Key Levels (1 to 3 weeks)
Intermediate resistance: 26750
Pivot (key resistance): 27350
Supports: 25920 & 25500
Next resistance: 28000/200
Directional Bias (1 to 3 weeks)
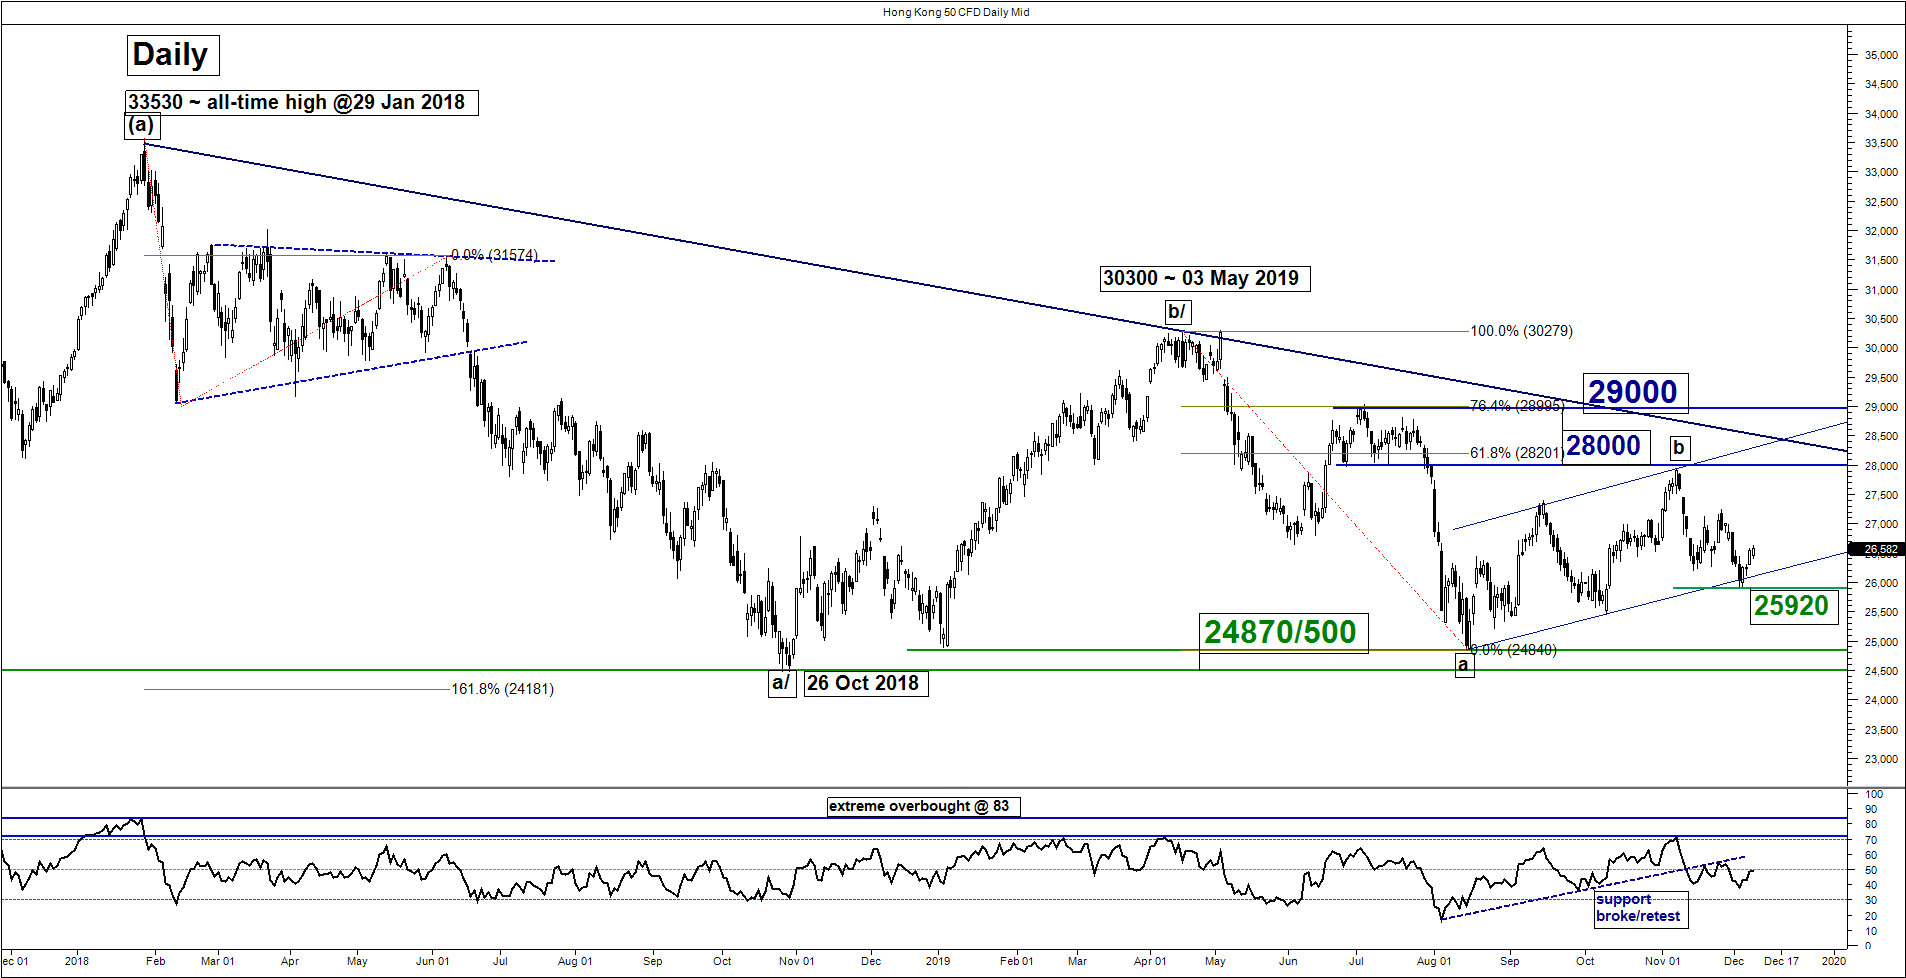
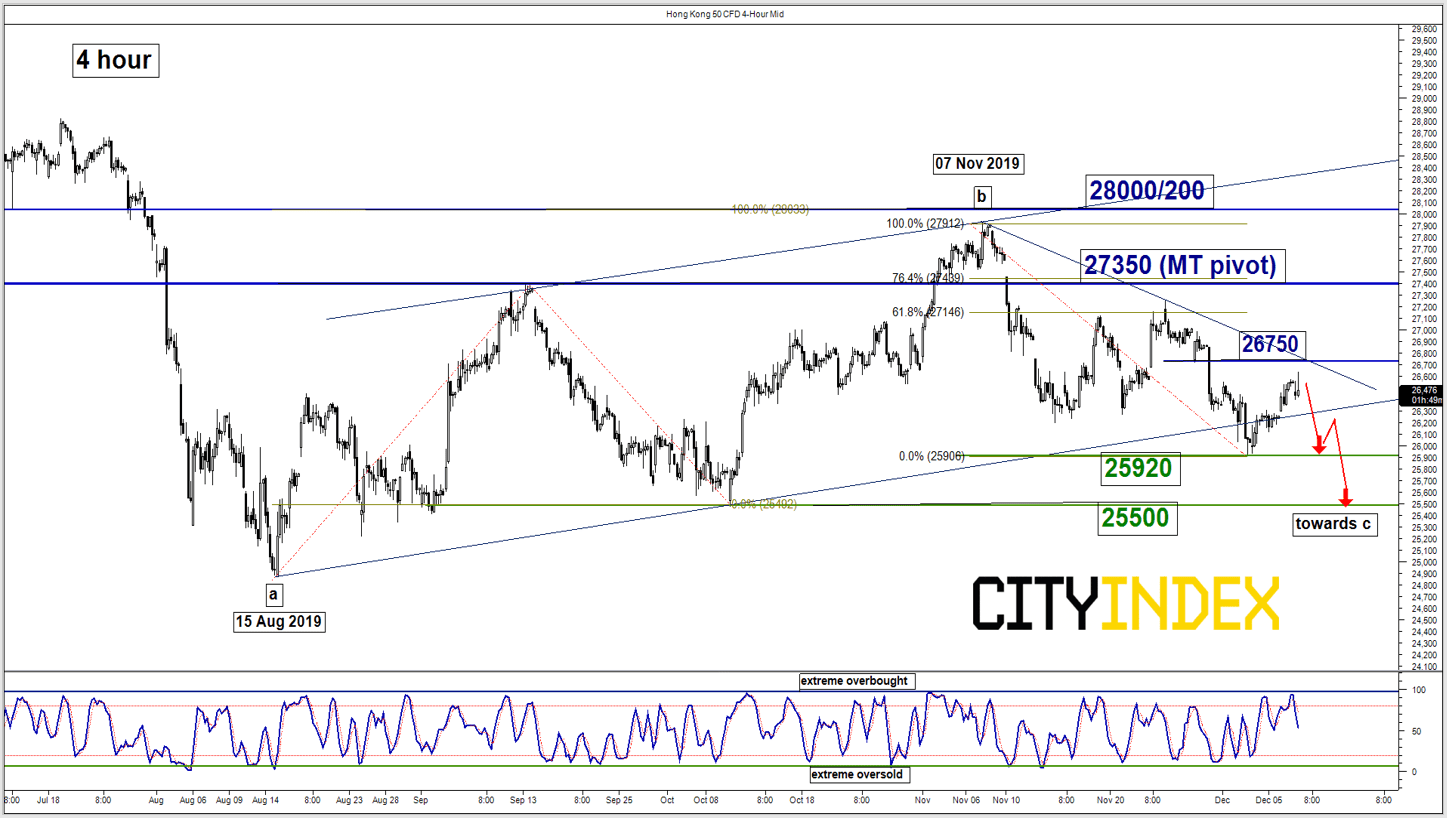
Last week, the Hong Kong 50 Index (proxy for Hang Seng Index futures) has staged the expected drop to print a low of 25920 on 03 Dec 2019 before it staged a rebound of 2.8% to print a current intraday high of 26634 in today, 09 Dec Asian session.
No change; maintain bearish bias below 27350 key medium-term pivotal resistance for a potential push down to retest last week’s low of 25920 and a break below it sees s further slide towards 25500 next (10 Oct 2019 swing low & 76.4% Fibonacci retracement of the up move from 15 Aug low to 07 Nov 2019 high).
On the other hand, a clearance with a daily close above 27350 negates the bearish tone for a push up to retest 28000/28200 (upper boundary of the ascending range in place since 15 Aug 2019 low & the 61.8% Fibonacci retracement of the previous decline from 03 May high to 15 Aug 2019 low).
Key elements
- Since its low of 24870 printed on 15 Aug 2019, the Index is still evolving within an ascending range configuration. Last week’s rebound from 03 Dec low of 25920 has stalled below the 61.8% Fibonacci retracement of the recent slide from 07 Nov 2019 high to 03 Dec 2019 low and the 26750 descending trendline resistance from 07 Nov 2019 high.
- The daily RSI oscillator remains bearish below the 50-level coupled with the 4-hour Stochastic oscillator that has exited from its overbought region.
ASX 200 – Mix elements
click to enlarge charts
Key Levels (1 to 3 weeks)
Supports: 6600 & 6400
Resistances: 6851 & 6990/7020
Directional Bias (1 to 3 weeks)
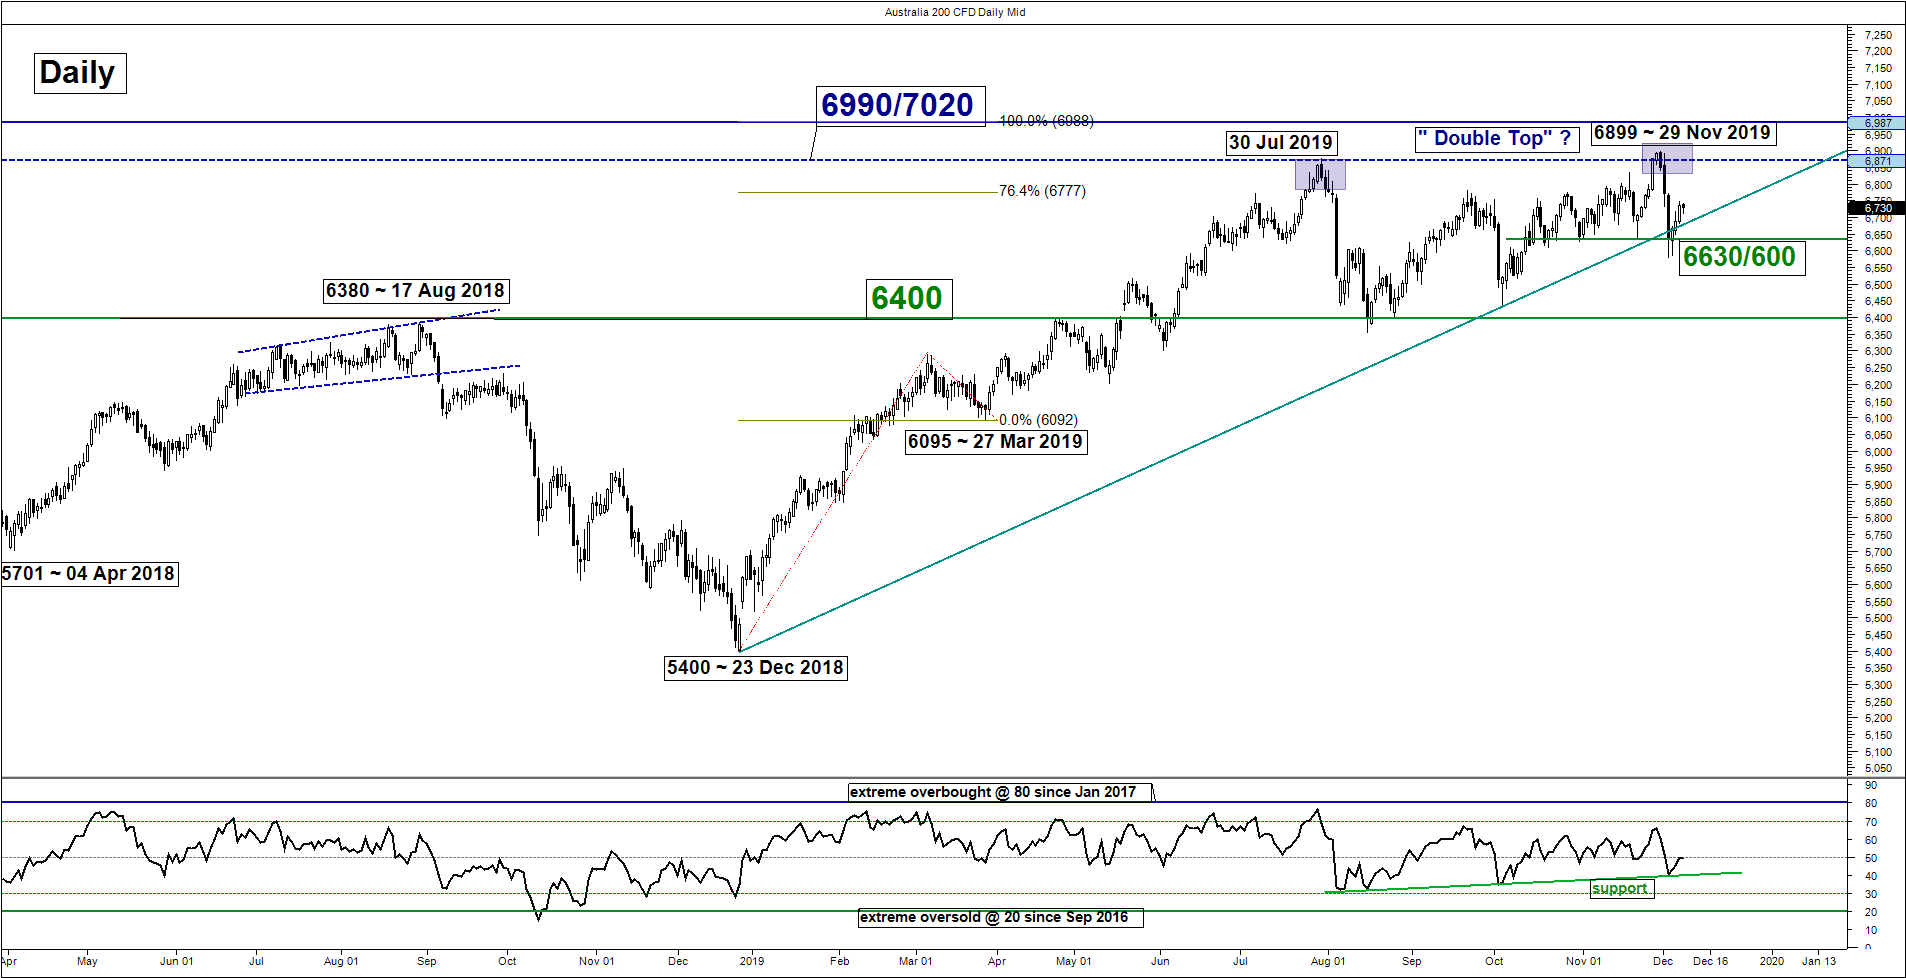
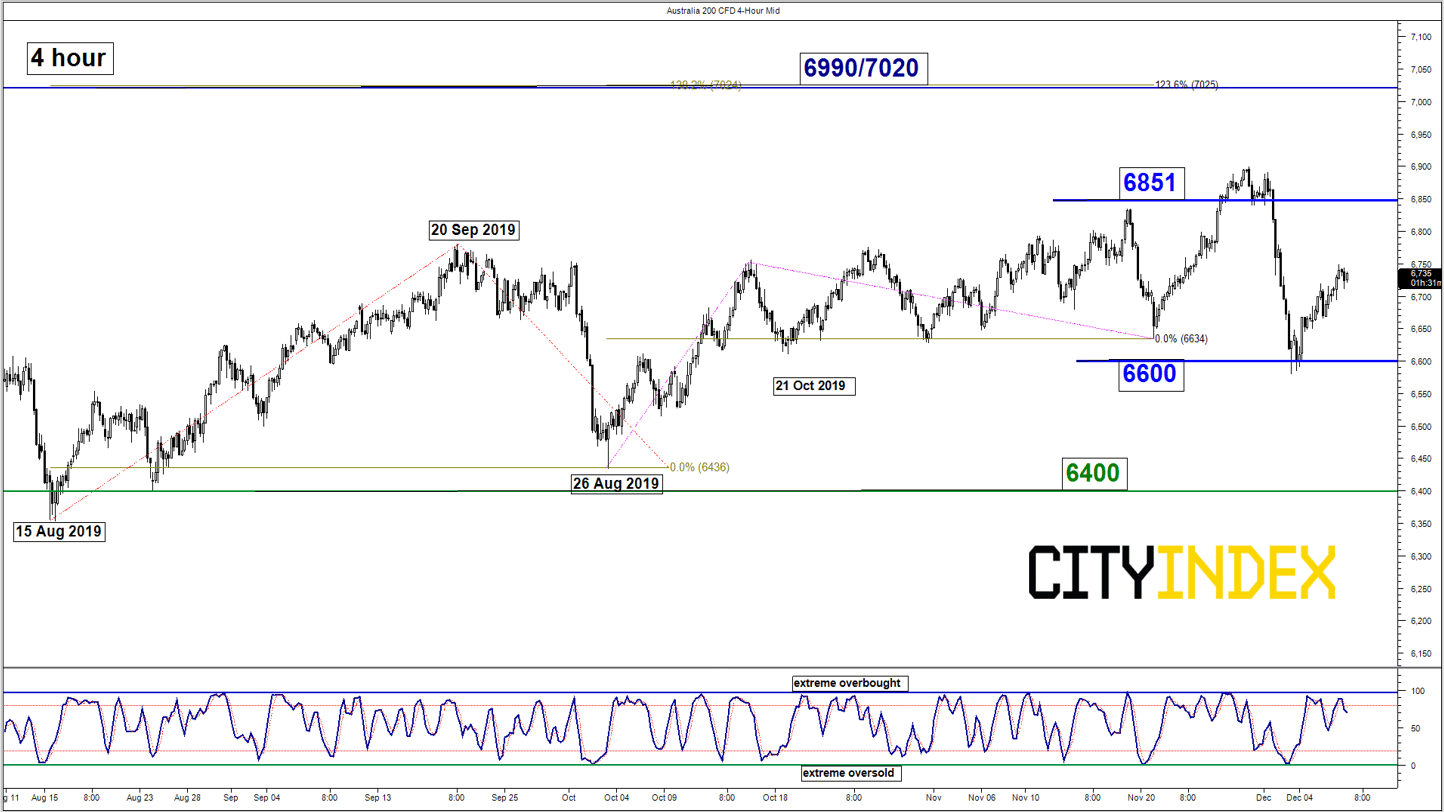
Last week, the Australia 200 (proxy for the ASX 200 futures) has staged another failure (the 2nd time) bullish breakout above the 6851 previous all-time high printed in Oct 2017 and tumbled below the 6780 key medium-term support.
Right now, elements are mix, thus we prefer to turn neutral first between 6851 and 6600. Only a clearance above 6851 reinstates the impulsive up move sequence to target the next resistance at 6990/7020. On the flipside, a break with a daily close below 6600 opens up scope for a further decline towards the next support at 6400.
Key elements
- After its second failed attempt to break above its 6851 previous all-time high, the Index has now started to form an impending major bearish reversal, “Double Top” configuration with its neckline support at 6400.
- On the other hand, last week’s drop of 4% has managed to stall at an ascending trendline from 23 Dec 2018 low, acting as a support at 6630/6600. In addition, the daily RSI oscillator has also staged a rebound at its corresponding ascending support at the 40-level. Conflicting signals.
DAX – Remain neutral
click to enlarge charts
Key Levels (1 to 3 weeks)
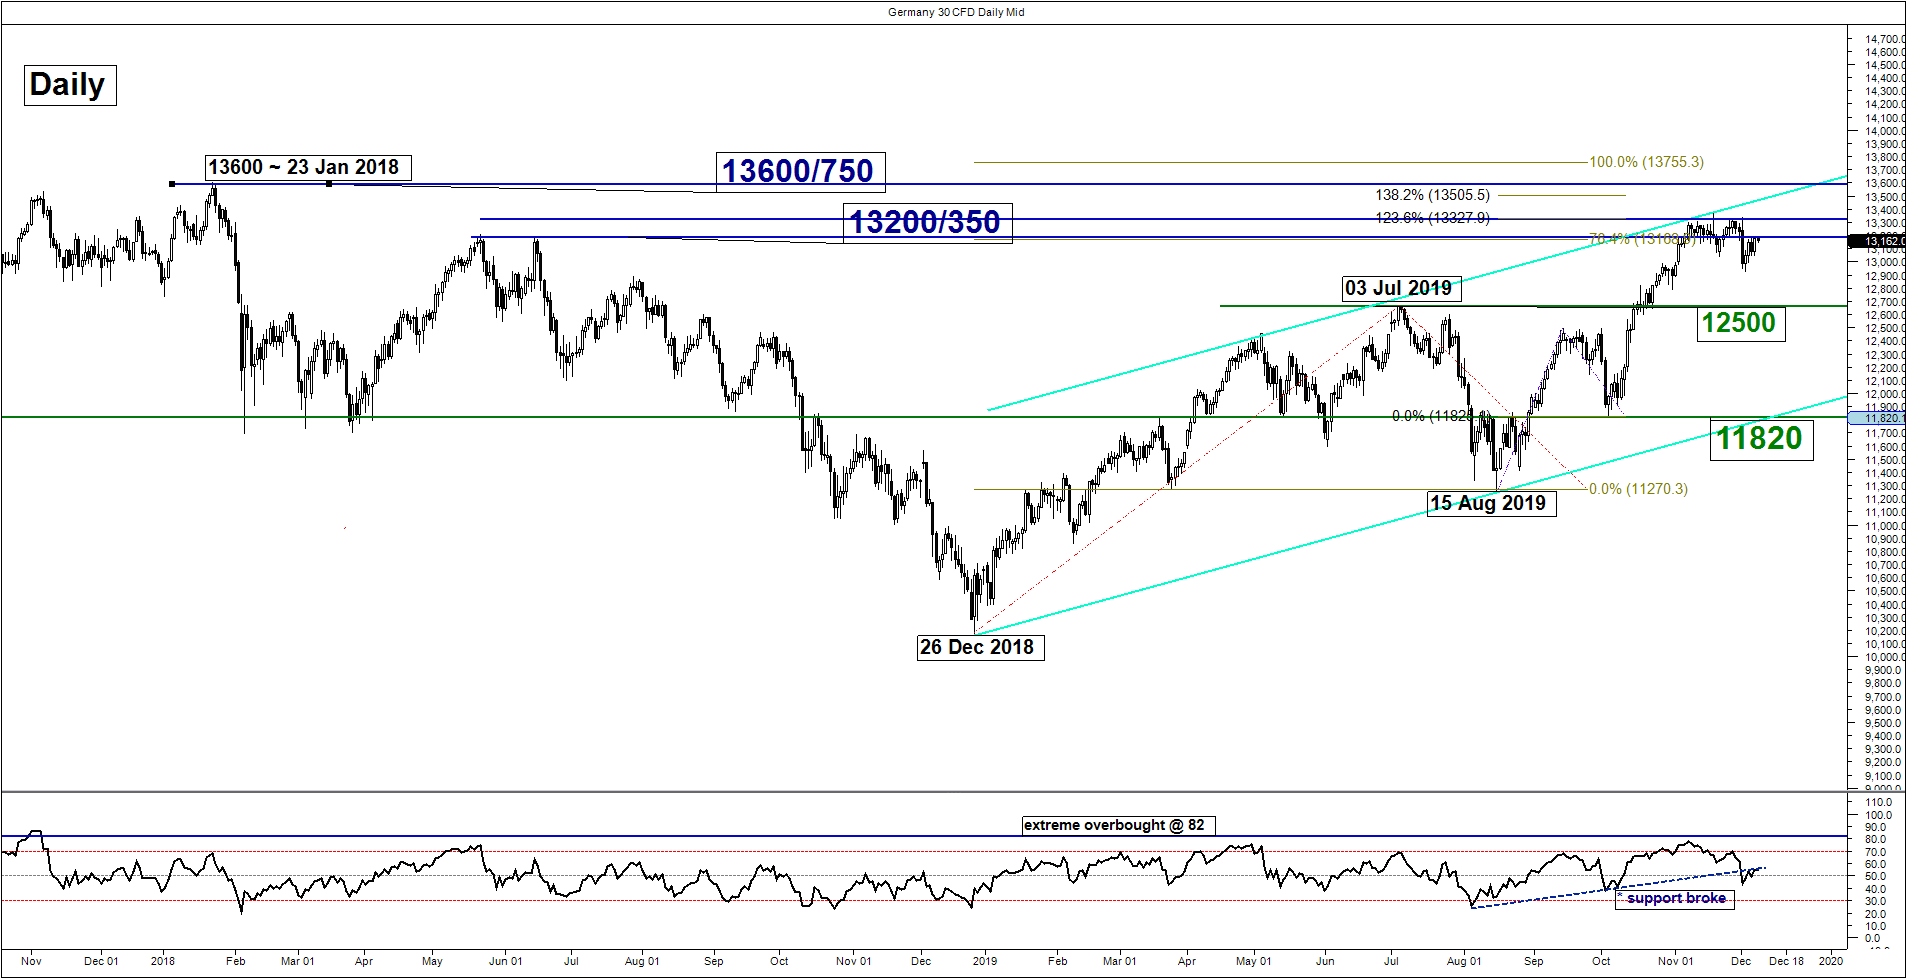
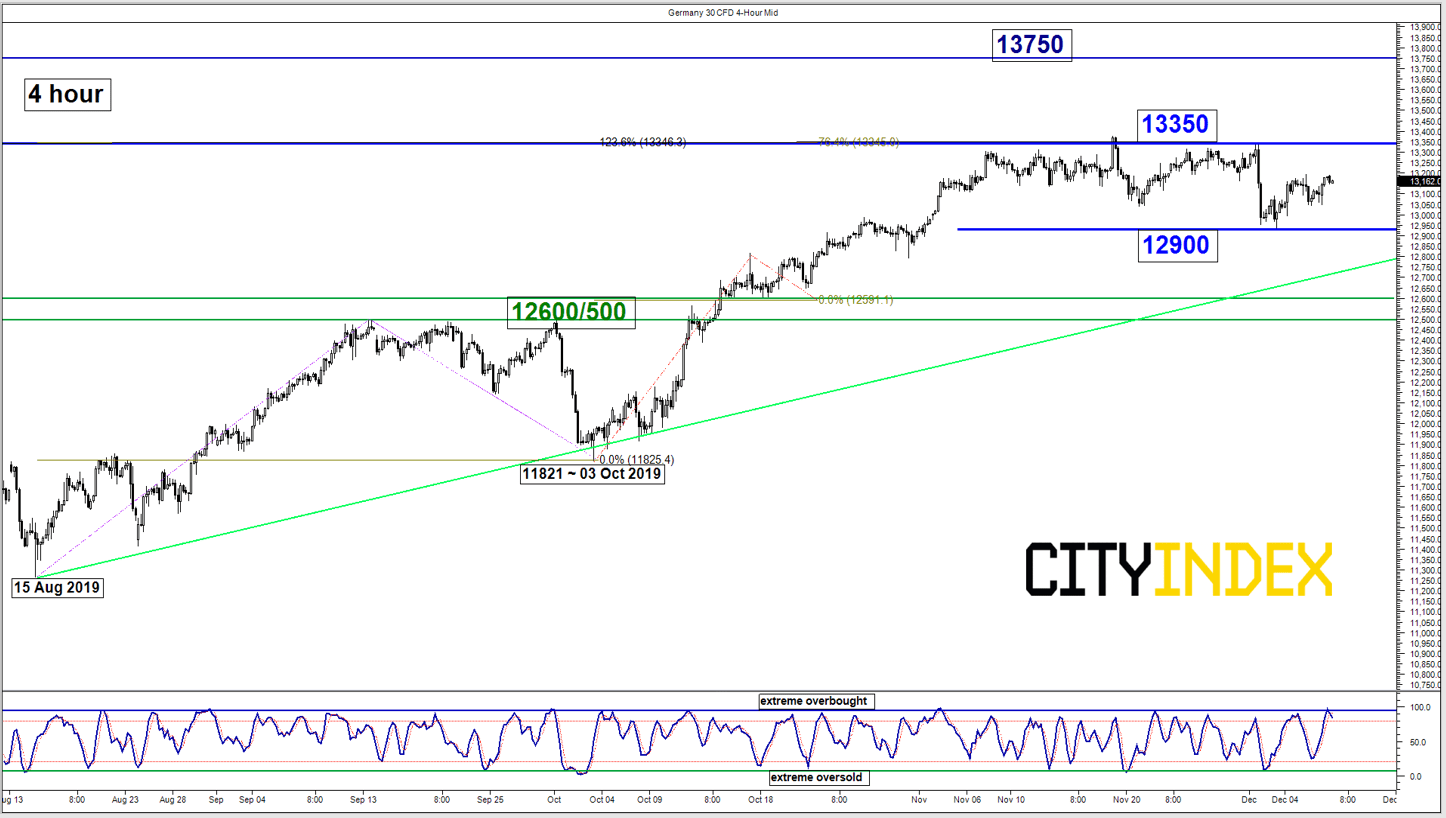
Resistances: 13350 & 13600/750 (all-time high)
Supports: 12900 & 12600/500
Directional Bias (1 to 3 weeks)
The Germany 30 Index (proxy for the DAX futures) has continued to trade within a sideways configuration below the 13350 range resistance in place since 19 Nov 2019 high.
Prefer to remain neutral between 12900 (last week’s swing low) and 13350. Bears need to have a break below 12900 to open up scope for a deeper slide towards 12600/500 support (the former swing high areas of 03 Jul/25 Jul 2019 & ascending trendline from 15 Aug 2019 low) before another leg of potential impulsive up move sequence unfolds.
On the flipside, a clearance above 13350 sees a further squeeze up to retest the current all-time high level of 13600/750 (also a Fibonacci expansion cluster).
Charts are from City Index Advantage TraderPro
Latest market news
Yesterday 03:00 PM
Yesterday 01:12 PM
Yesterday 11:14 AM
Yesterday 08:28 AM
April 24, 2024 03:30 PM
Latest Australia 200 articles
February 15, 2024 11:33 PM
February 15, 2024 01:42 AM
February 14, 2024 05:39 AM