


S&P 500 – Conflicting signal from VIX
click to enlarge charts
Key Levels (1 to 3 weeks)
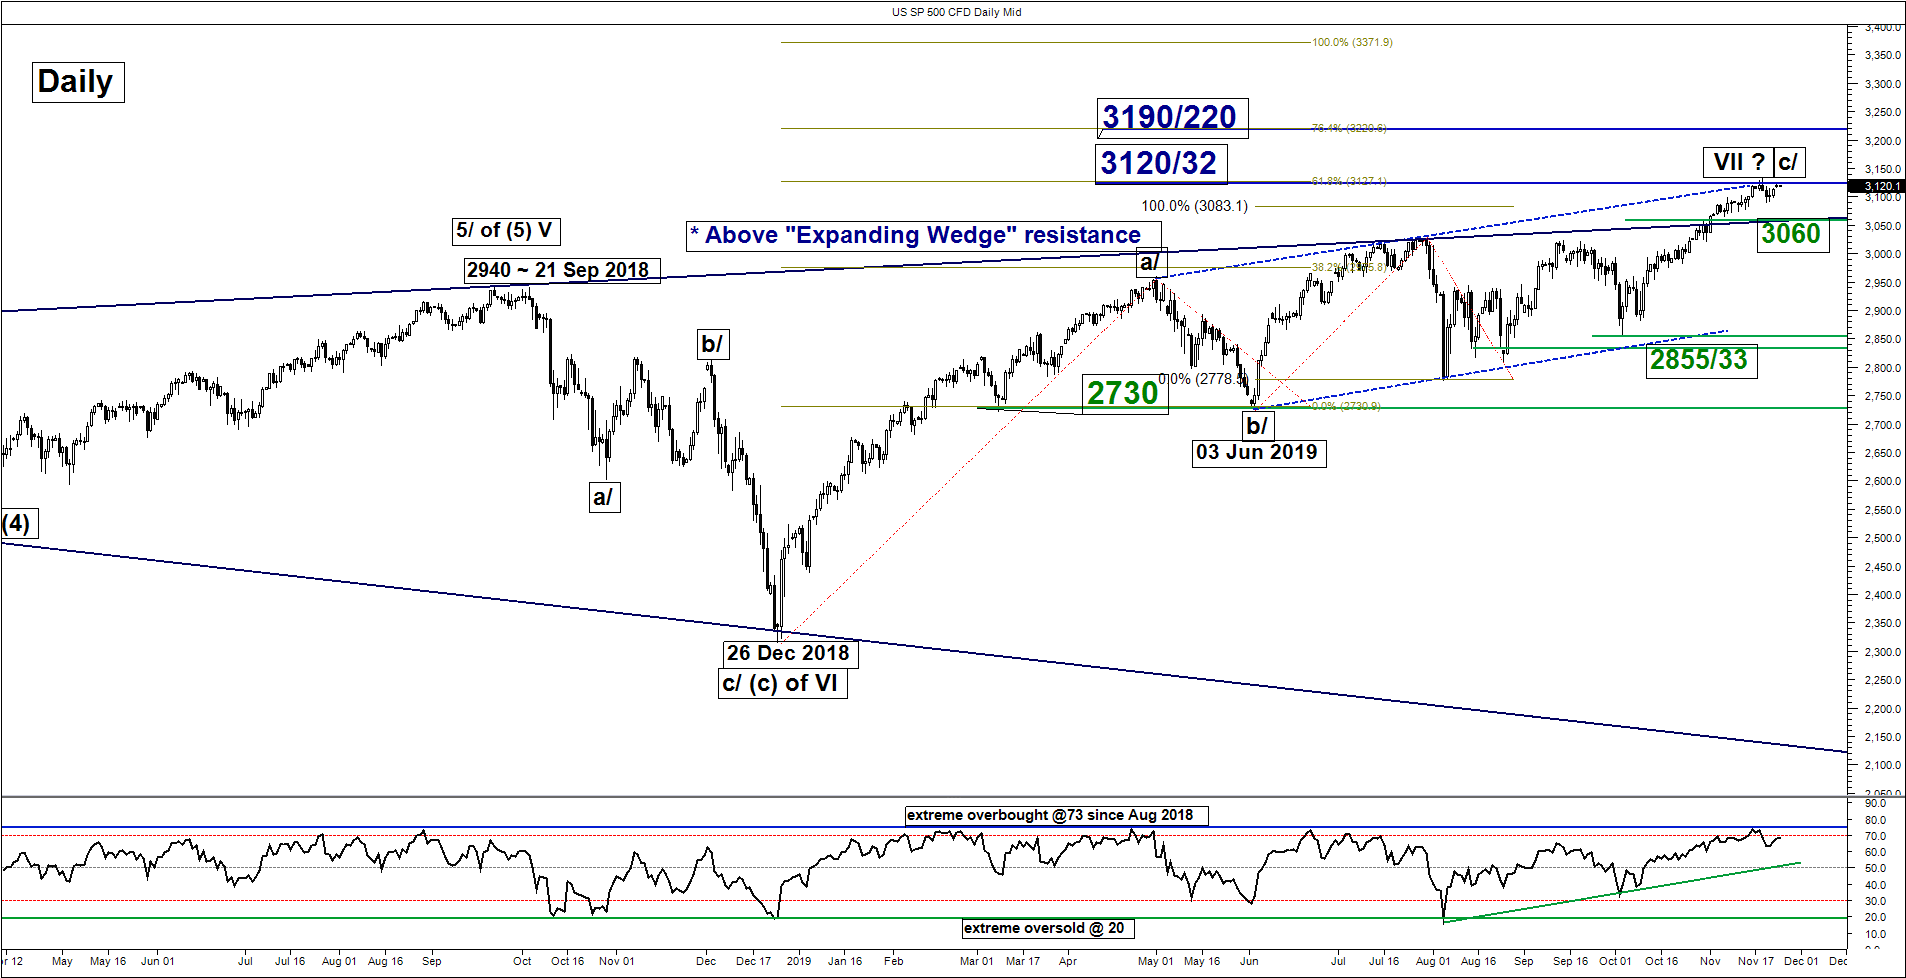
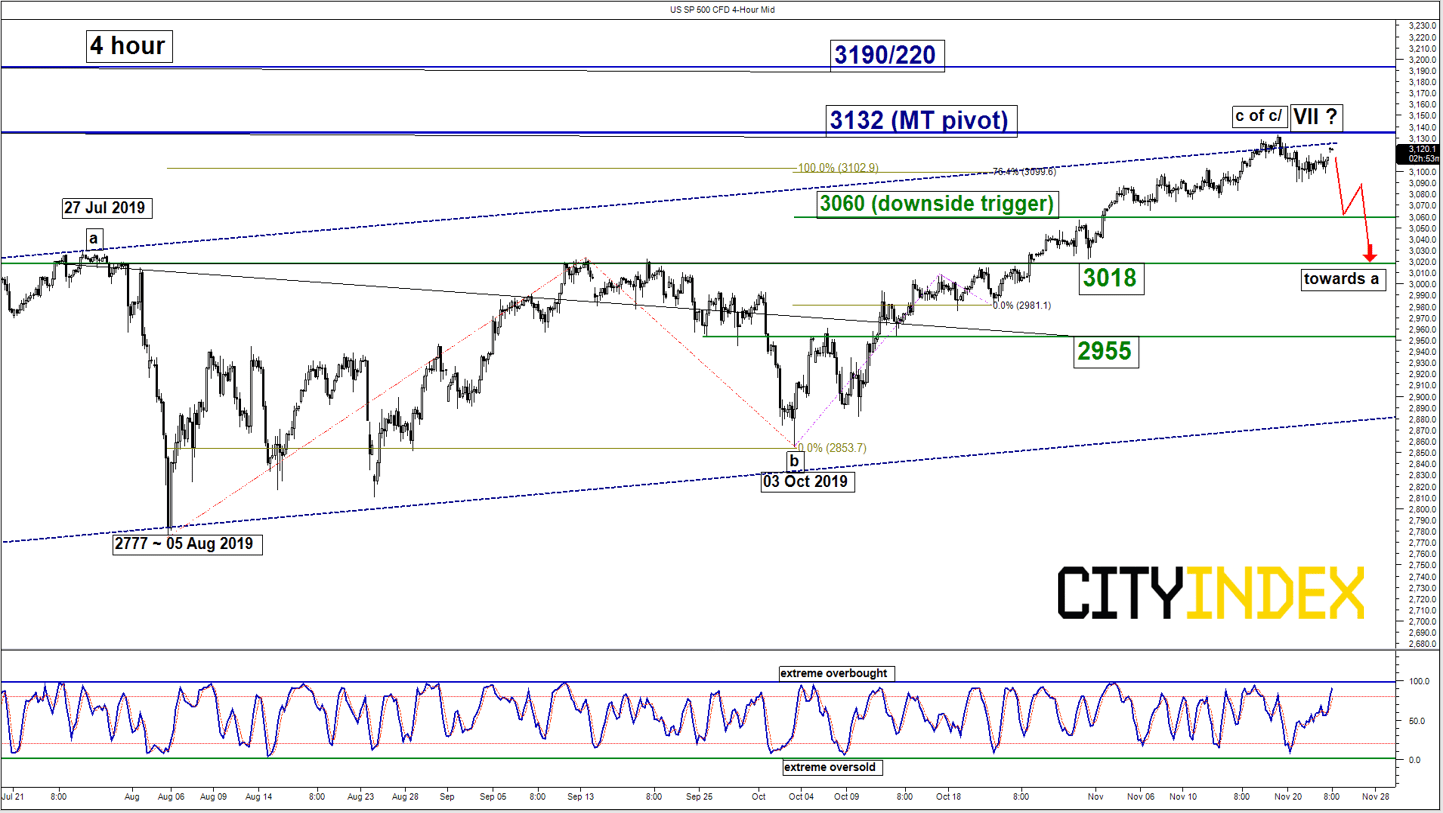
Pivot (key resistance): 3120/32
Supports: 3060 (trigger), 3018 & 2955
Next resistance: 3190/220
Directional Bias (1 to 3 weeks)
Last week, the SP 500 Index ((proxy for the S&P 500 futures) has remained in a churning mode where it has challenged the 3120 key medium-term pivotal resistance; printed a high of 3132 on Tues, 19 Nov before it drifted back down on the backdrop of “hot and cold” U.S.-China trade deal related news flow (click here for a recap).
From a technical analysis perspective, several key elements have turned “less positive” for the bulls that warrant caution on chasing this uptrend. Thus, we maintain the bearish bias below 3120 and a break below 3060 reinforces the start of a potential multi-week corrective decline to target the next supports at 3018 follow by 2955 next.
On the other hand, a clearance with a daily close above 3120 invalidates the bearish scenario for a further squeeze up towards the next resistance 3190/220 (Fibonacci expansion cluster).
Key elements
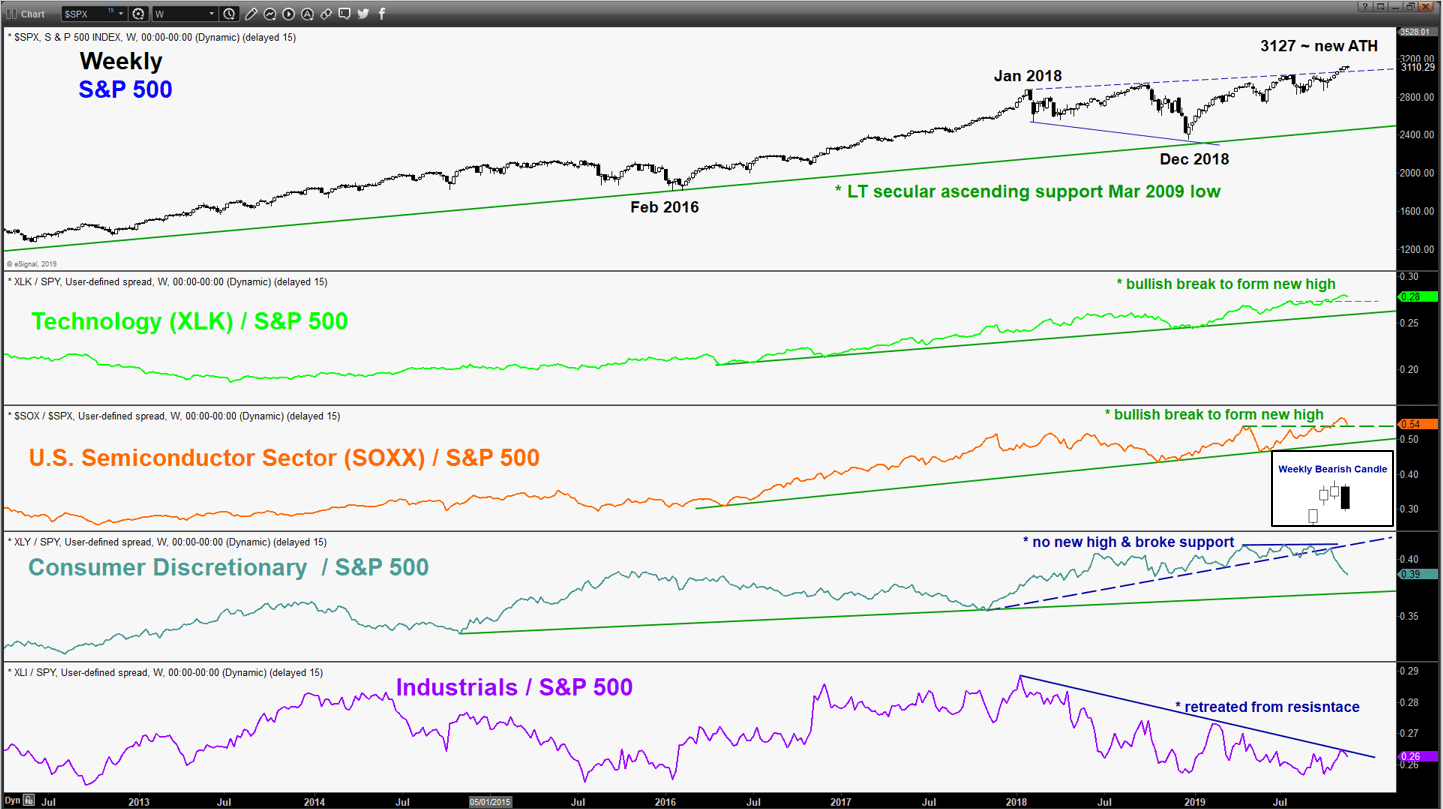
- One of the leading sectors, the Semiconductors (SOXX) has started to show sign of weariness where it has formed a weekly bearish candlestick that has wiped out the combined gains seen in the prior two weeks (refer to the 3rd chart).
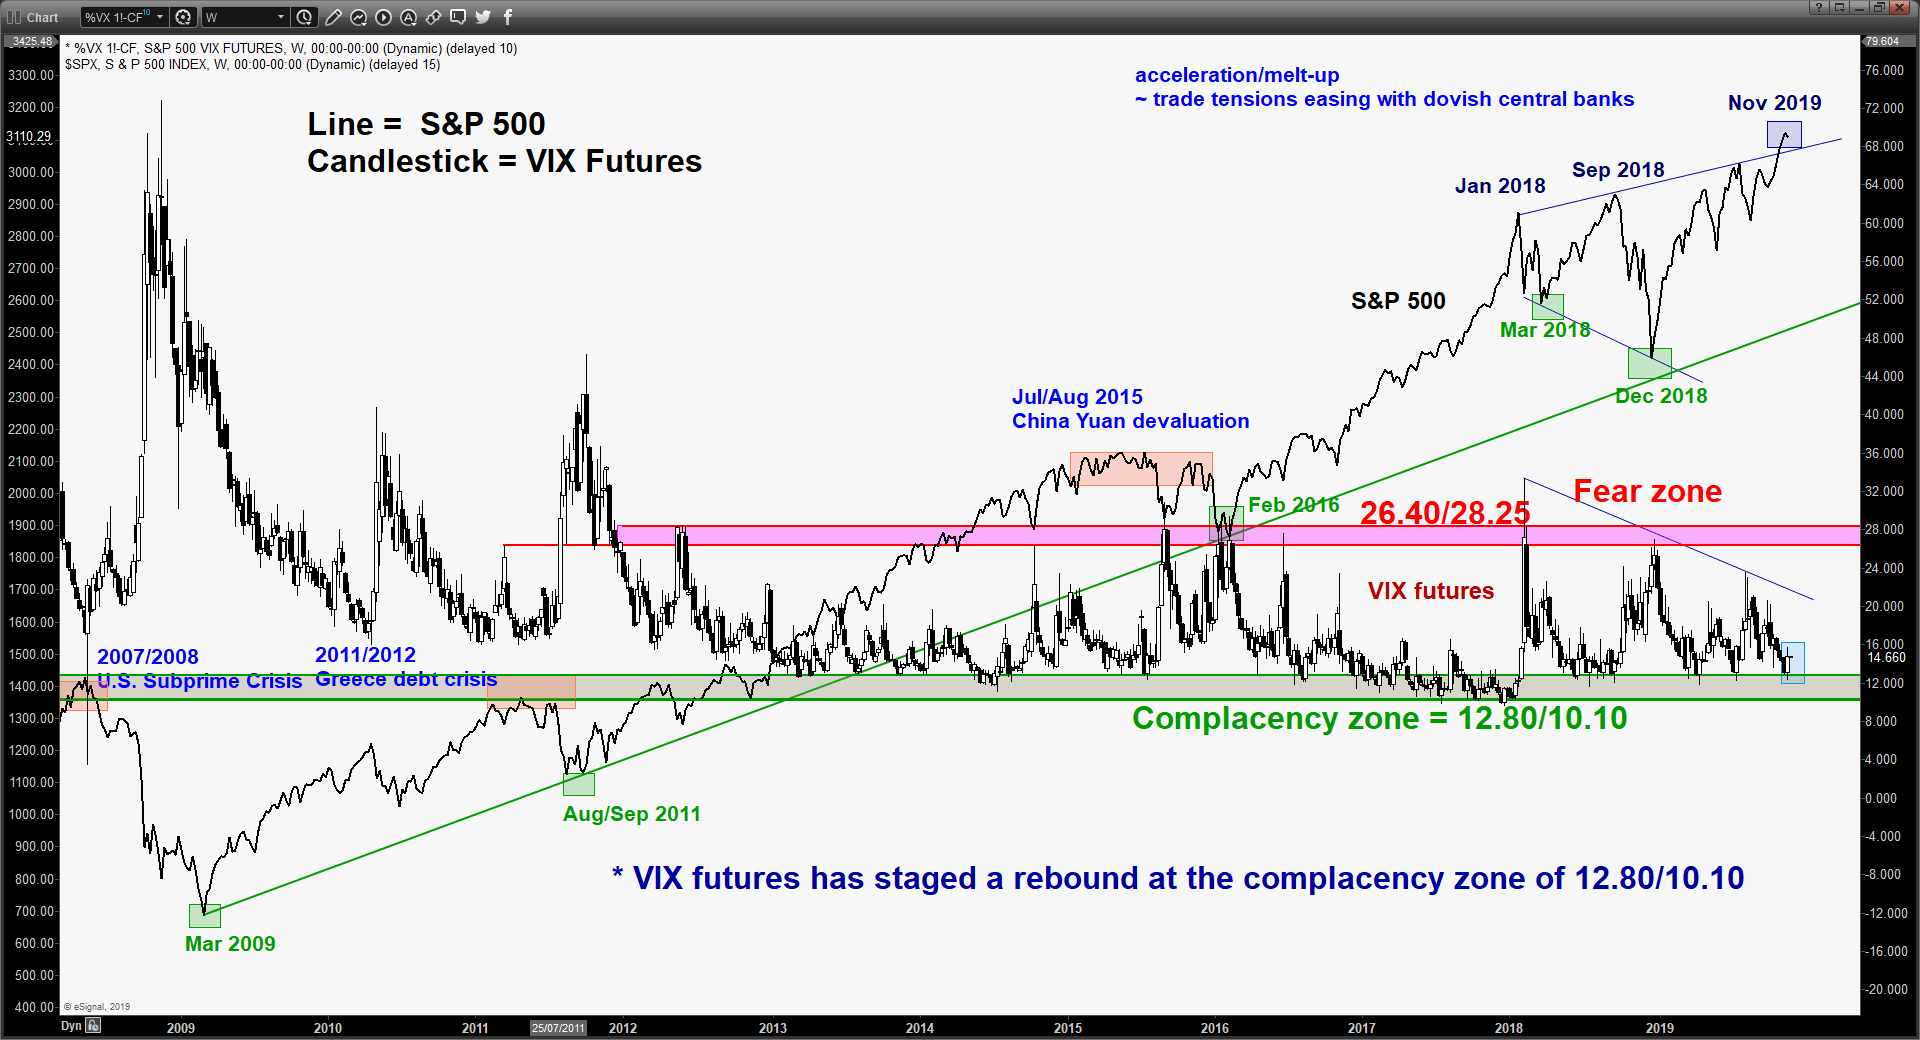
- The VIX futures has staged a rebound at upper boundary of the 12.80/10.10 “complacency zone” and ended last week with a bullish weekly candlestick. From a contrary opinion perspective, this observation indicates a relatively high degree of “greed/fear of missing out” behaviour traits where the risk of a downside reversal in price action of the S&P 500 increases at this juncture as any price sensitive news flow can disappoint the mood of the market easily (refer to 4th chart).
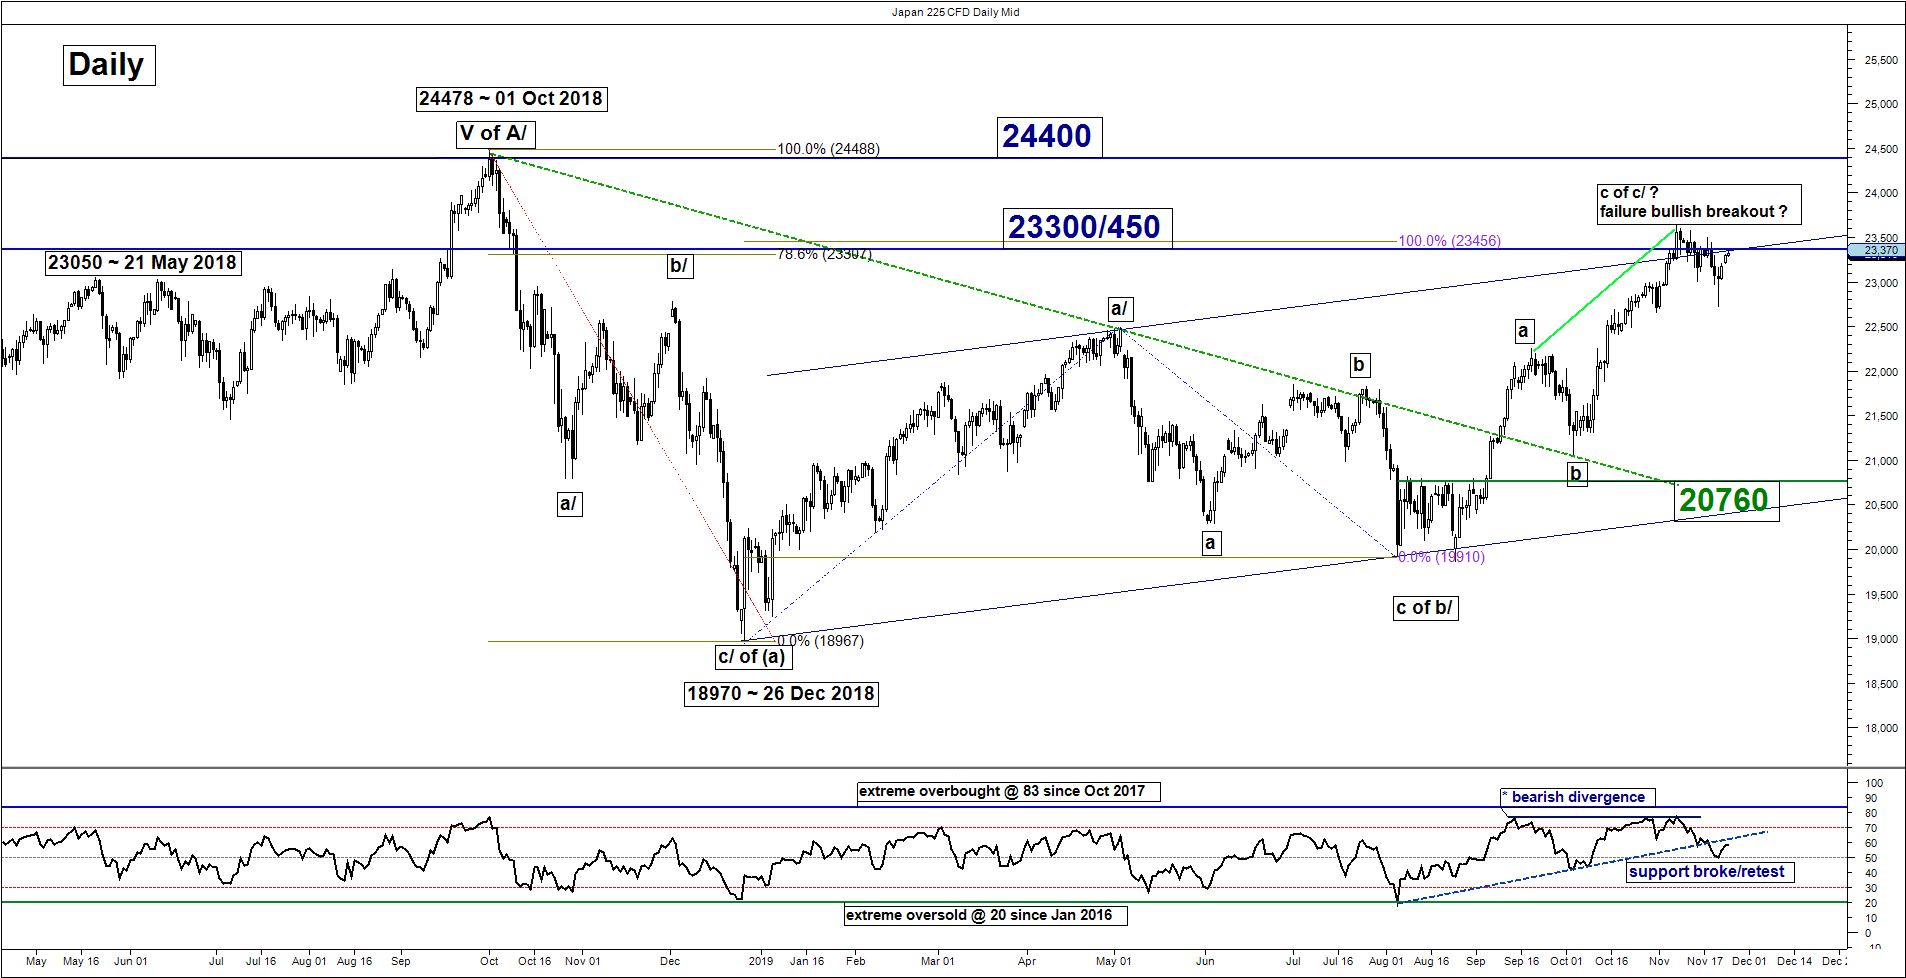
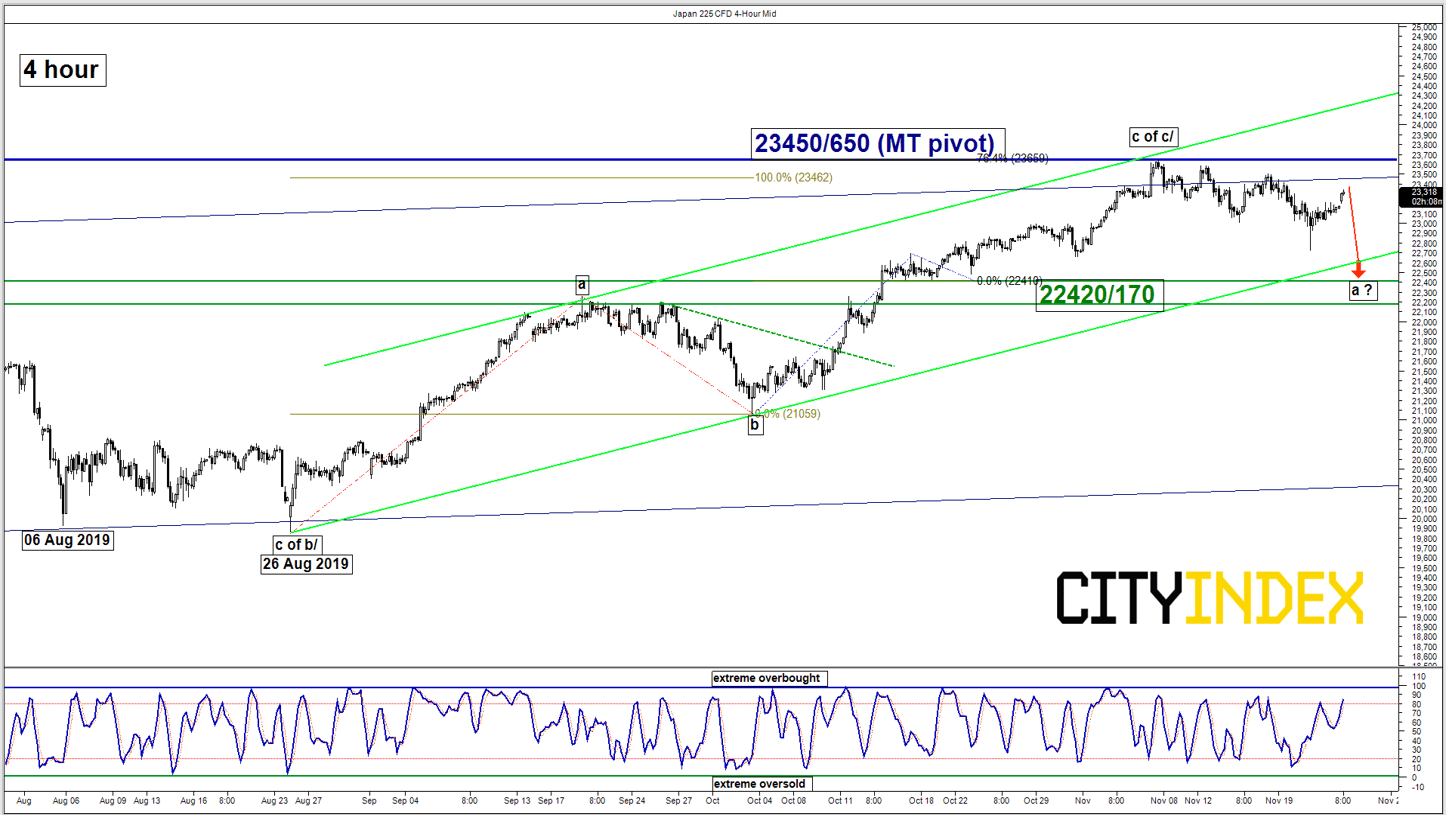
Nikkei 225 – 23650 remains the key resistance to watch
click to enlarge charts
Pivot (key resistance): 23450/23650 (excess)
Support: 22420/170
Next resistance: 24400
Directional Bias (1 to 3 weeks)
Last, the Japan 225 Index (proxy for the Nikkei 225 futures) has drifted down lower as expected to print a low of 22728 on last Thurs, 21 Nov. Thereafter, it has retraced by 76.4% of the prior slide from 18 Nov minor swing high of 23502 to last Thurs low of 22728) where it has gapped up to print a current intraday high of 23339 in today, 25 earlier Asian session on the backdrop of a positive trade related news flow on Sun where China has decided to rise penalties on intellectual property thief.
Overall, key technical elements remain the same. Thus, maintain bearish bias below the 23650 (excess) medium-term pivotal resistance for a further potential drop towards the 22420/170 support zone. On the other hand, a clearance with a daily close above 23650 invalidates the bearish scenario for an extension of the up move towards the next resistance at 24400 (01 Oct 2018 major swing high area).
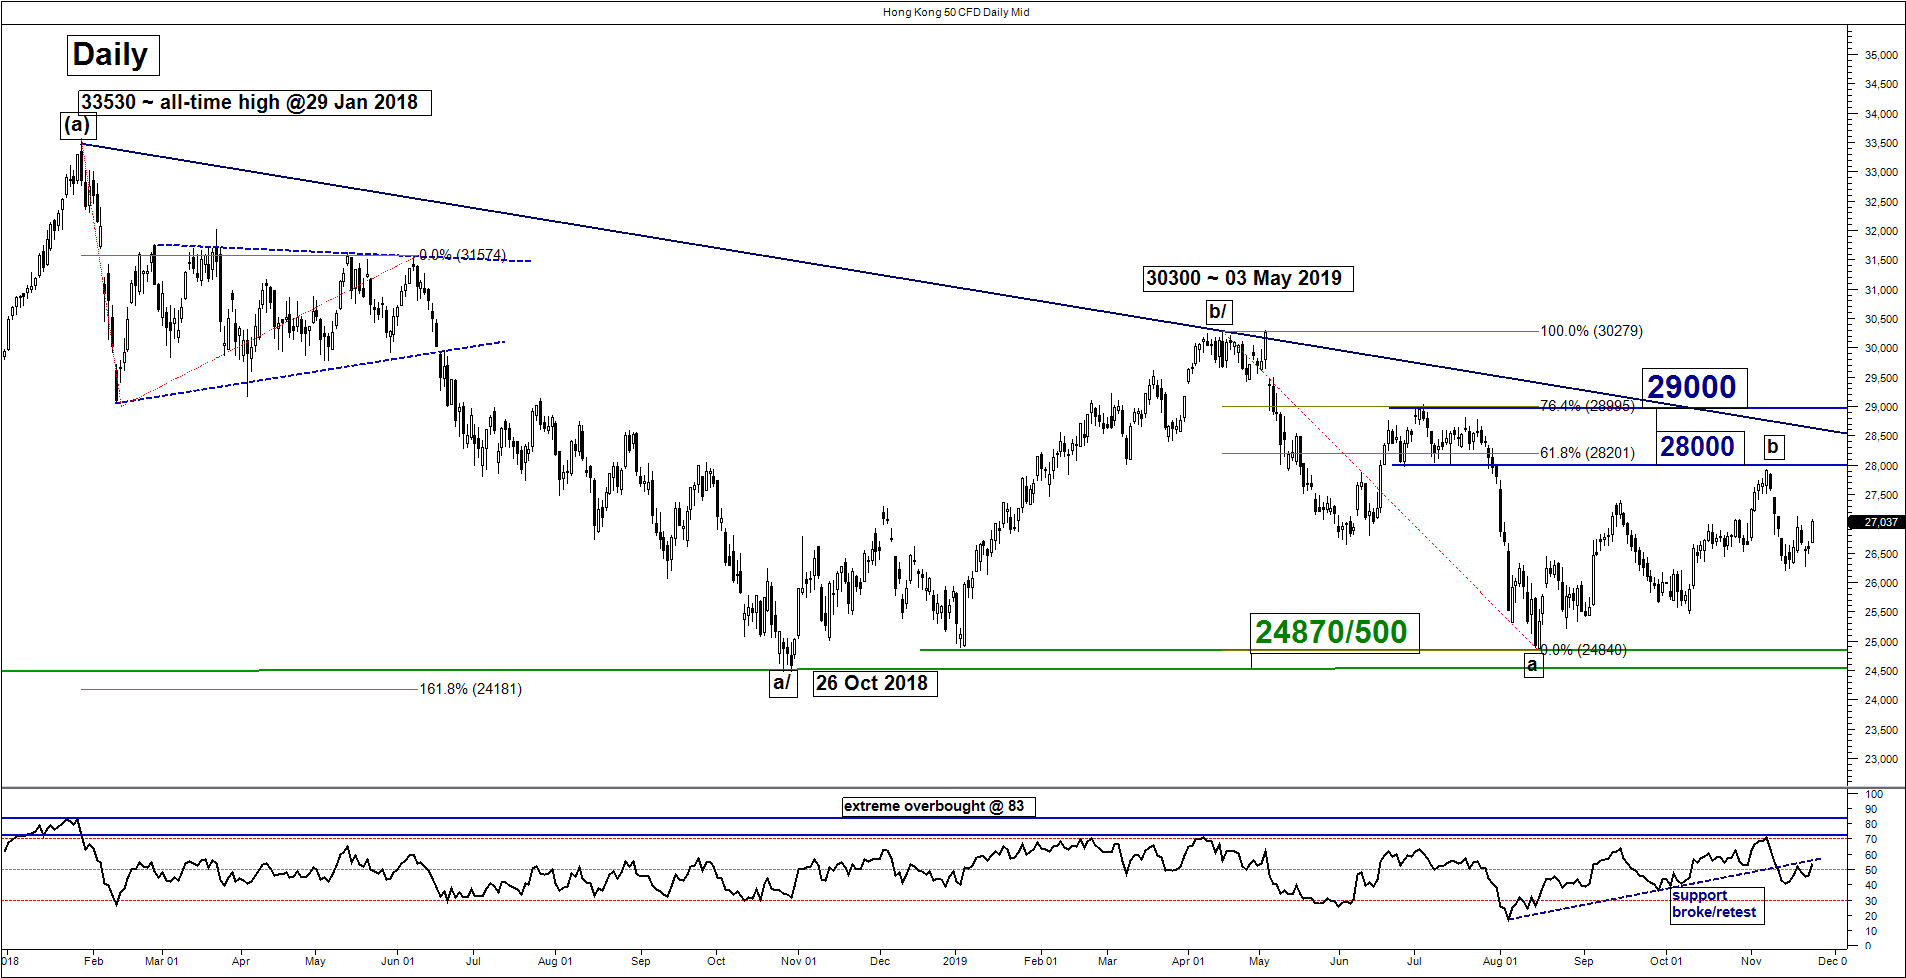
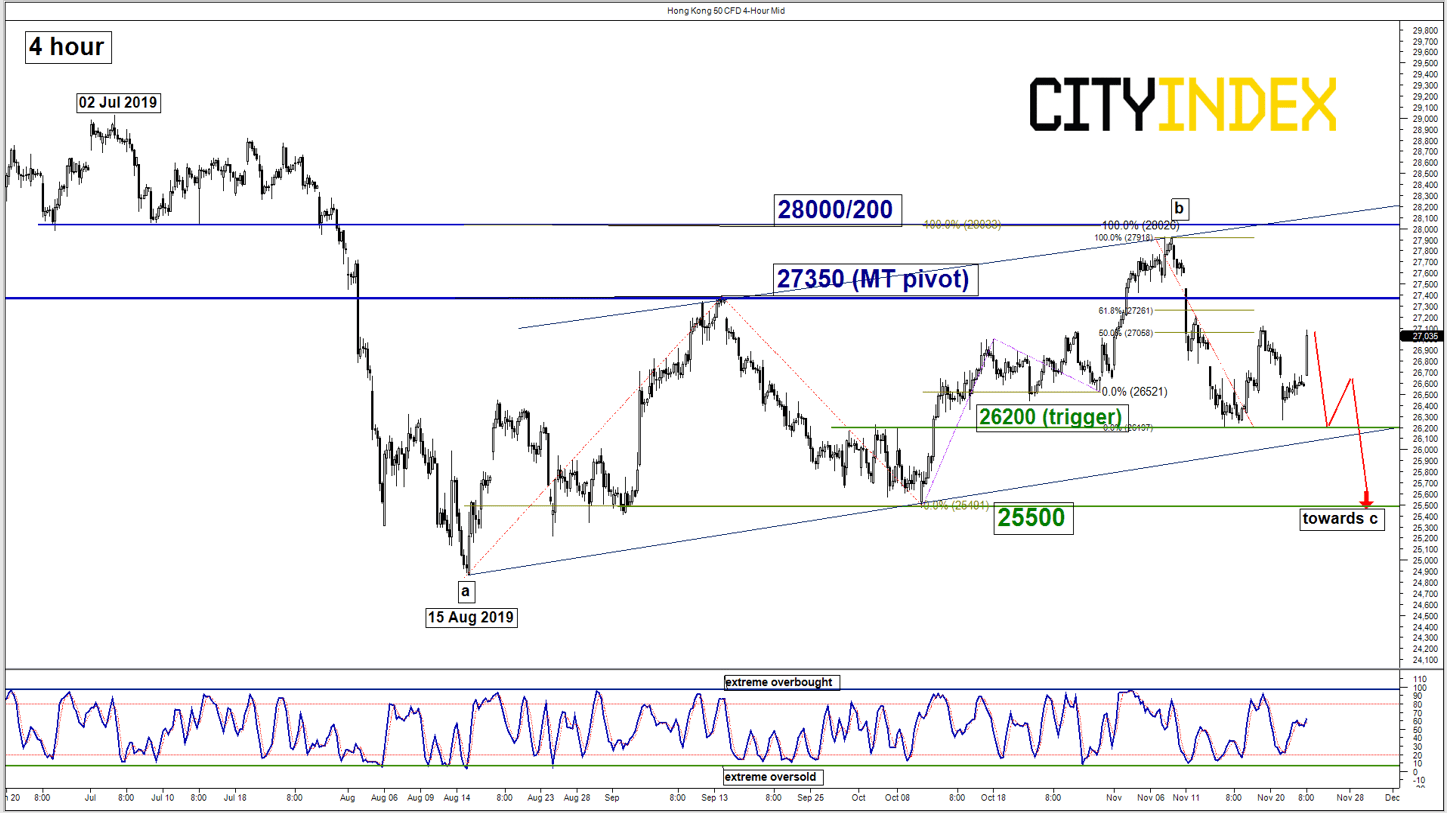
Hang Seng – Sideways below 27350 resistance
click to enlarge charts
Key Levels (1 to 3 weeks)
Pivot (key resistance): 27350
Support: 26200 & 25500
Next resistance: 28000/200
Directional Bias (1 to 3 weeks)
Last week, the Hong Kong 50 Index (proxy for Hang Seng Index futures) has traded sideways below the 27350 key medium-term pivotal resistance.
No change, maintain bearish bias below 27350 and added 26200 as the downside trigger level to reinforce a further potential drop towards the next support at 25500 (10 Oct 2019 swing low & 76.4% Fibonacci retracement of the up move from 15 Aug low to 07 Nov 2019 high).
On the other hand, a clearance with a daily close above 27350 negates the bearish tone for a push up to retest 28000/28200 (upper boundary of the ascending range in place since 15 Aug 2019 low & 61.8% Fibonacci retracement of the previous decline from 03 May high to 15 Aug 2019 low).
ASX 200 – Further potential drop below 6820
click to enlarge charts
Key Levels (1 to 3 weeks)
Intermediate resistance: 6760
Pivot (key resistance): 6820
Supports: 6610 & 6530
Next resistances: 6878 & 6690/7020
Directional Bias (1 to 3 weeks)
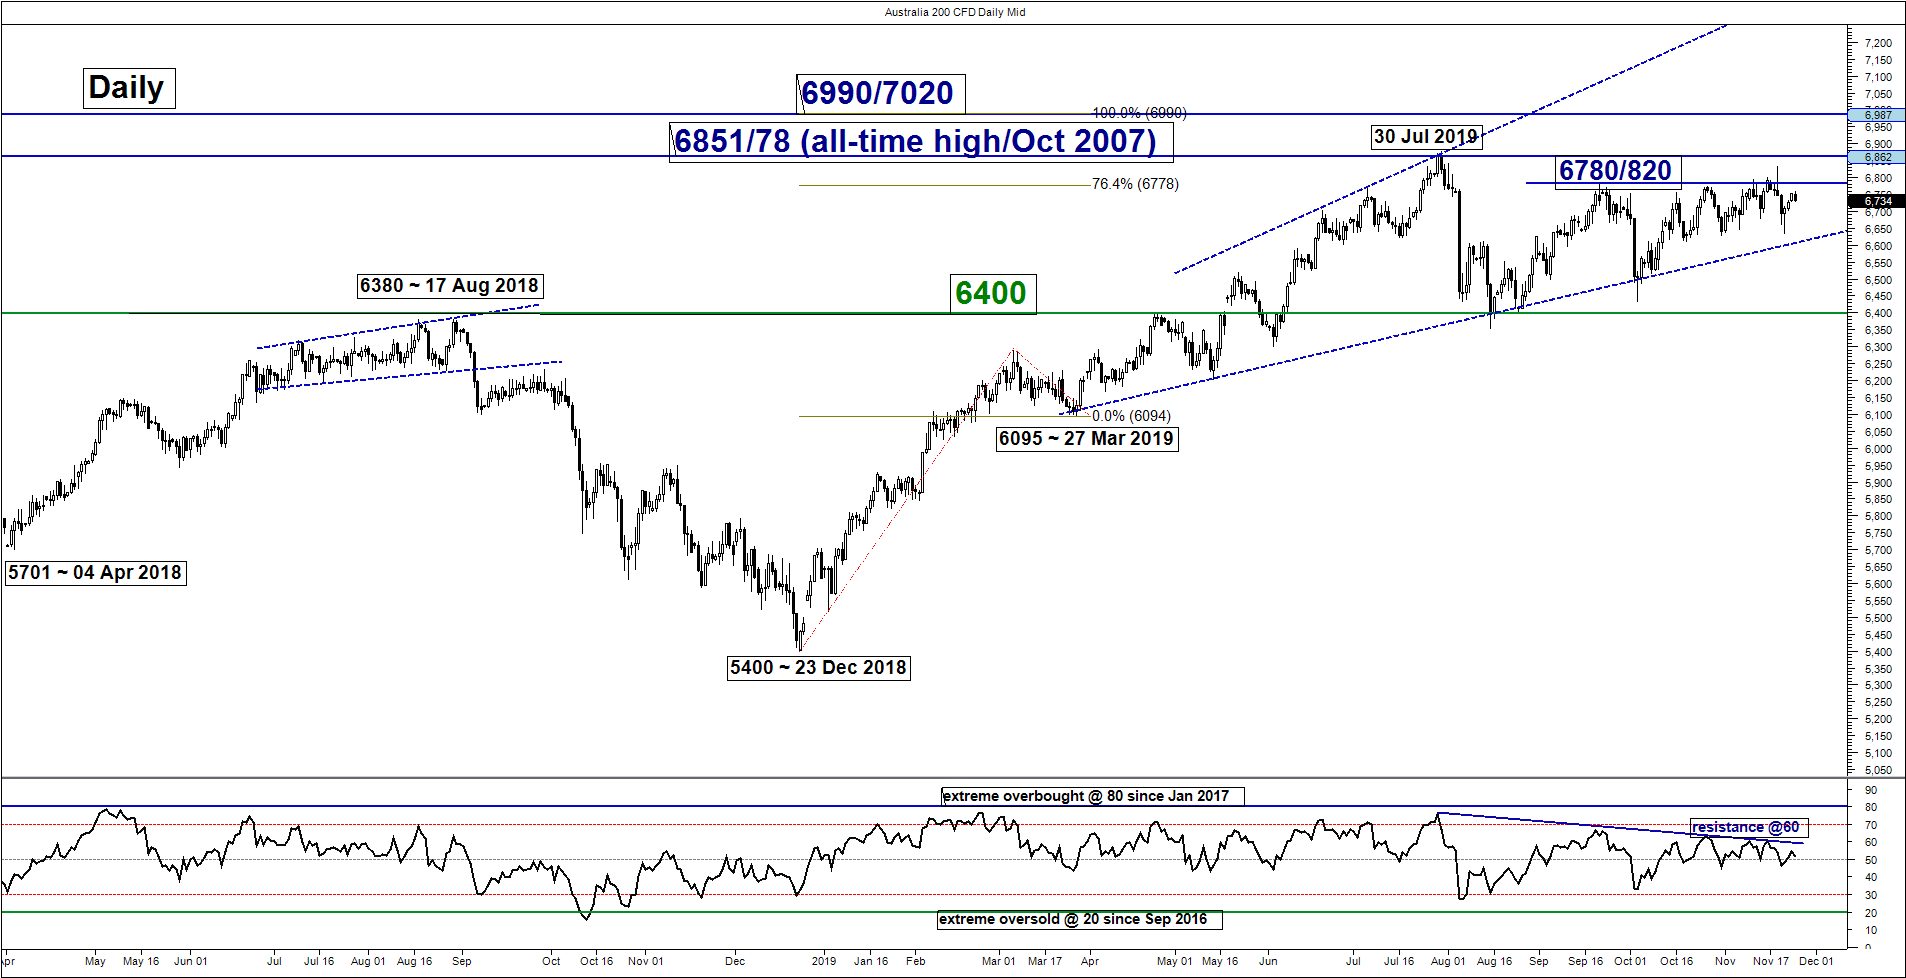
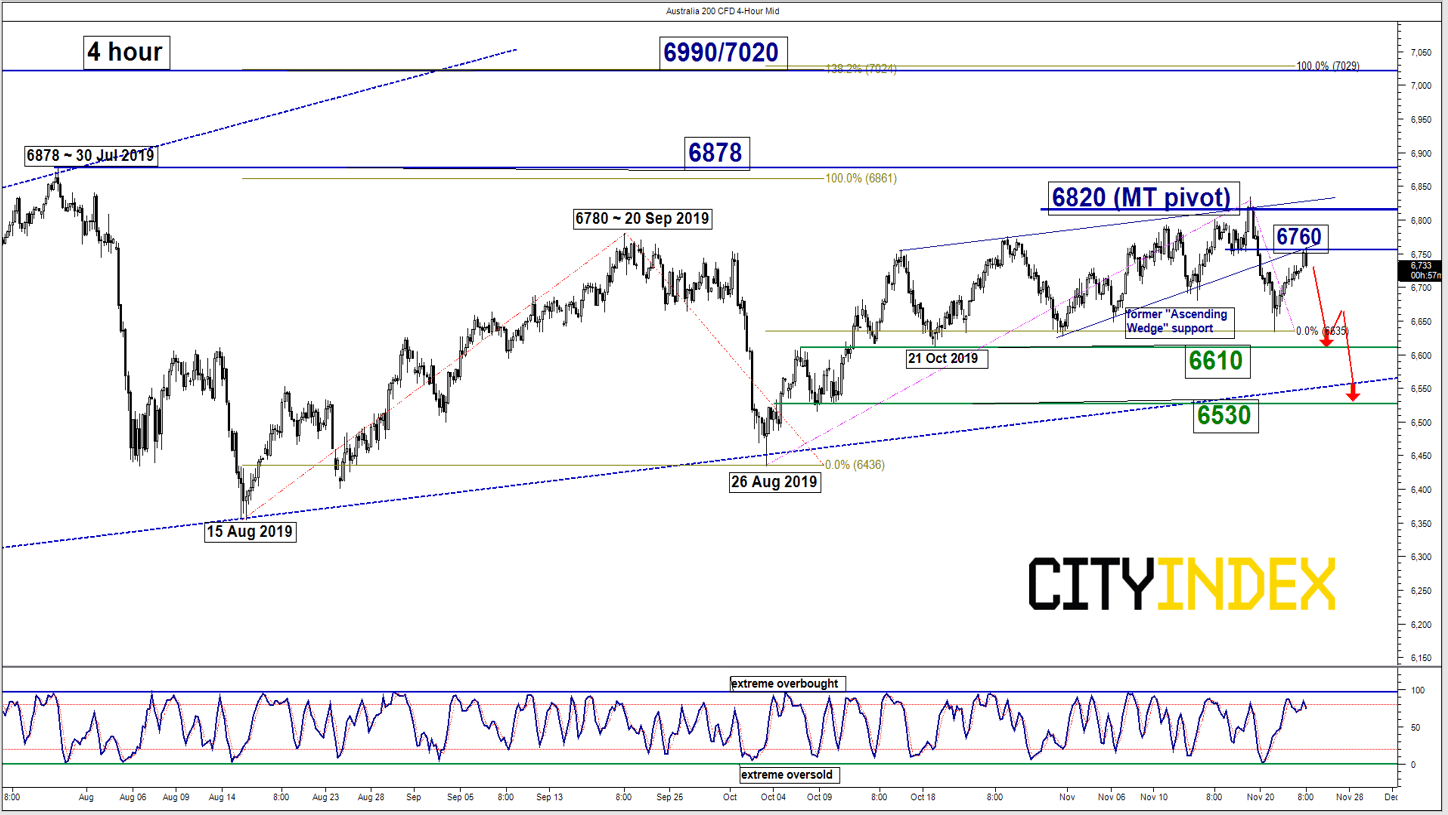
Last week, the Australia 200 (proxy for the ASX 200 futures) has staged another test (3rd attempt) on the 6780/820 key medium-term pivotal resistance (the range resistance in place since 20 Sep 2019) before it dropped by -2.8% to print a low of 6634 on last Thurs, 21 Nov.
Maintain bearish bias below 6820 for another potential downleg to target the next supports at 6610 and 6530 (the lower boundary of a major “Expanding Wedge” configuration in place since 27 Mar 2019 low).
On the other hand, a clearance with a daily close above 6820 invalidates the bearish scenario for a continuation of the impulsive up move sequence to retest the 30 Jul 2019 swing high/all-time high area of 6878 and above sees 6690/7020 next (Fibonacci expansion cluster).
Key elements
- The daily RSI oscillator has continued to trace out a series of “lower highs” below a corresponding significant resistance at the 60 level which indicates the lack of upside momentum.
- The recent push up in price action from 6634 low has stalled at the 6760 pull-back resistance of the former minor “Ascending Wedge” support and the 61.8% Fibonacci retracement of the recent slide from 19 Nov high to 21 Nov 2019 low.
DAX – Bullish exhaustion detected at 13350 resistance
click to enlarge charts
Key Levels (1 to 3 weeks)
Pivot (key resistance): 13200/350 (excess)
Supports: 13090, 12800 & 12600/500
Next resistance: 13600/750 (all-time high)
Directional Bias (1 to 3 weeks)
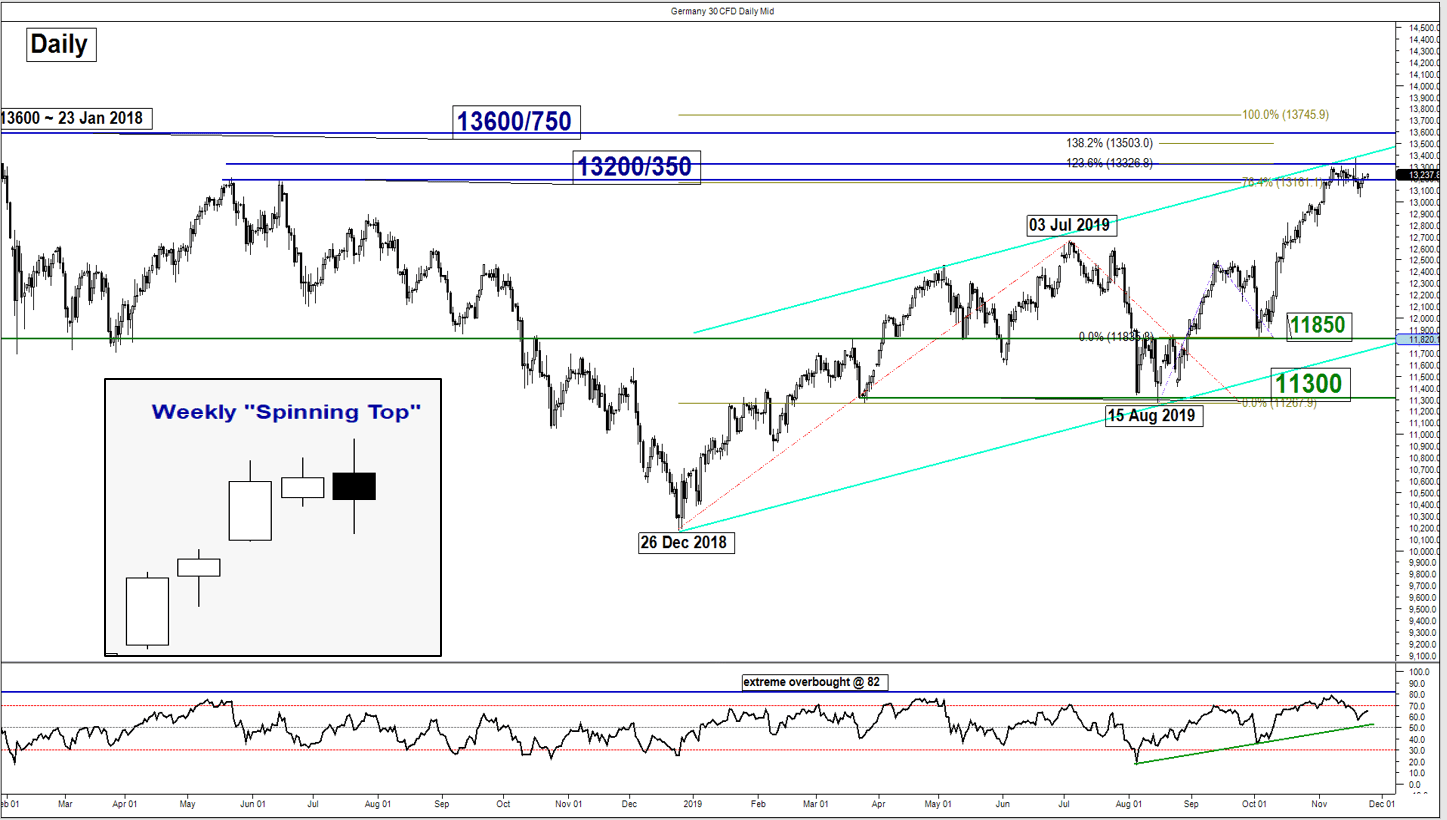
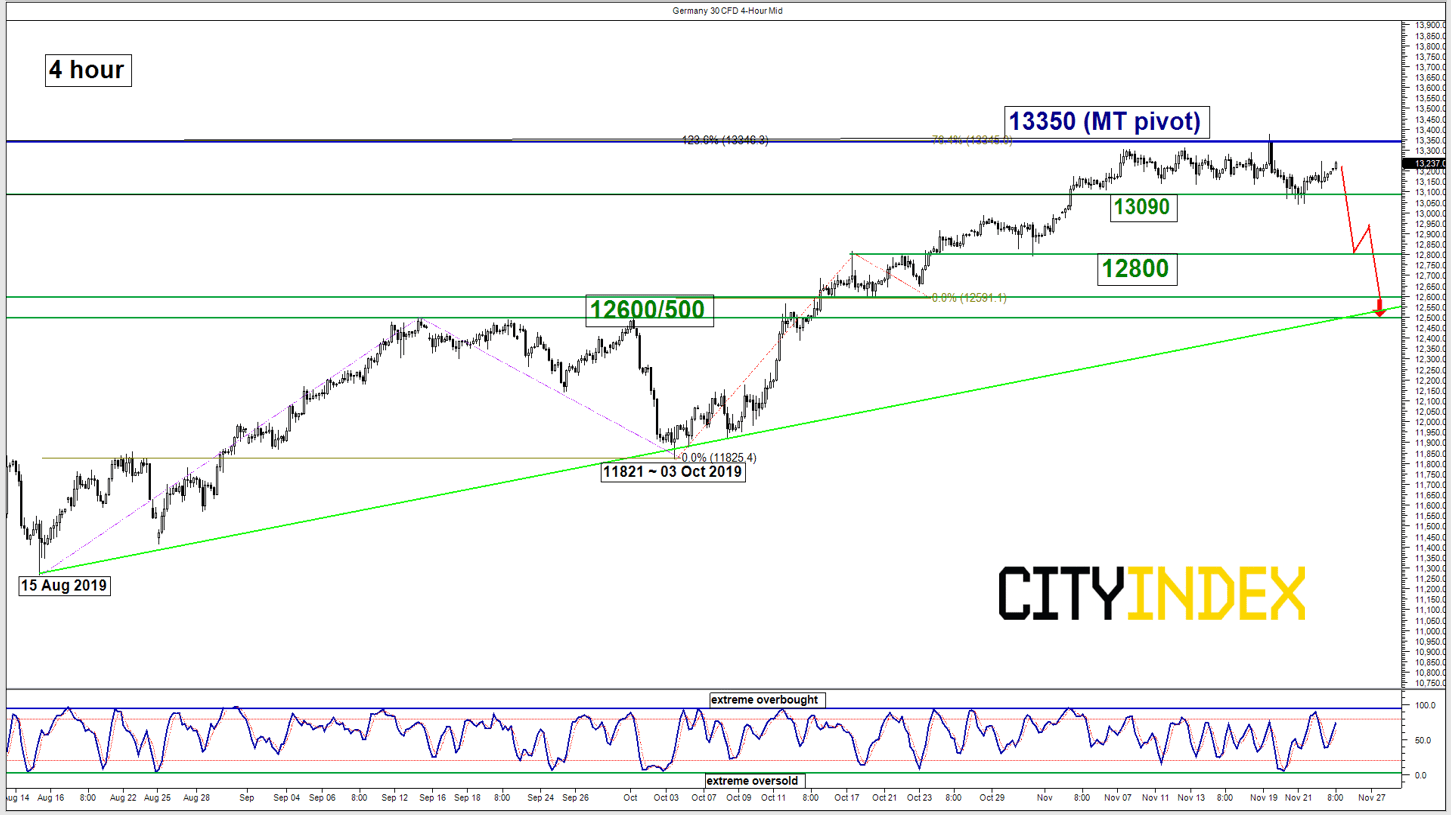
The Germany 30 Index (proxy for the DAX futures) has retreated from the 13350 key medium-term pivotal resistance as per expected and formed a weekly “Spinning Top” candlestick pattern at the end of last week after 6 consecutive weeks of positive closes since 07 Oct 2019.
These observations suggest the bulls are getting “indecisive” to push up prices higher. Maintain bearish bias below 13350 for a retest on 13090 (last week’s swing low) and a break below it reinforces a further potential drop to target the next supports at 12800 and 12600/500 (the former swing high areas of 03 Jul/25 Jul 2019 & ascending trendline from 15 Aug 2019 low.
On the other hand, a clearance with a daily close above 13350 invalidates the bearish scenario for an extension of the up move to retest the current all-time high level of 13600/750 (also a Fibonacci expansion cluster).
Charts are from City Index Advantage TraderPro & eSignal
Latest market news
Yesterday 03:00 PM
Yesterday 01:12 PM
Yesterday 11:14 AM
Latest Australia 200 articles
February 15, 2024 11:33 PM
February 15, 2024 01:42 AM
February 14, 2024 05:39 AM