


S&P 500 – Eyeing another potential new all-time high
click to enlarge charts
Key Levels (1 to 3 weeks)
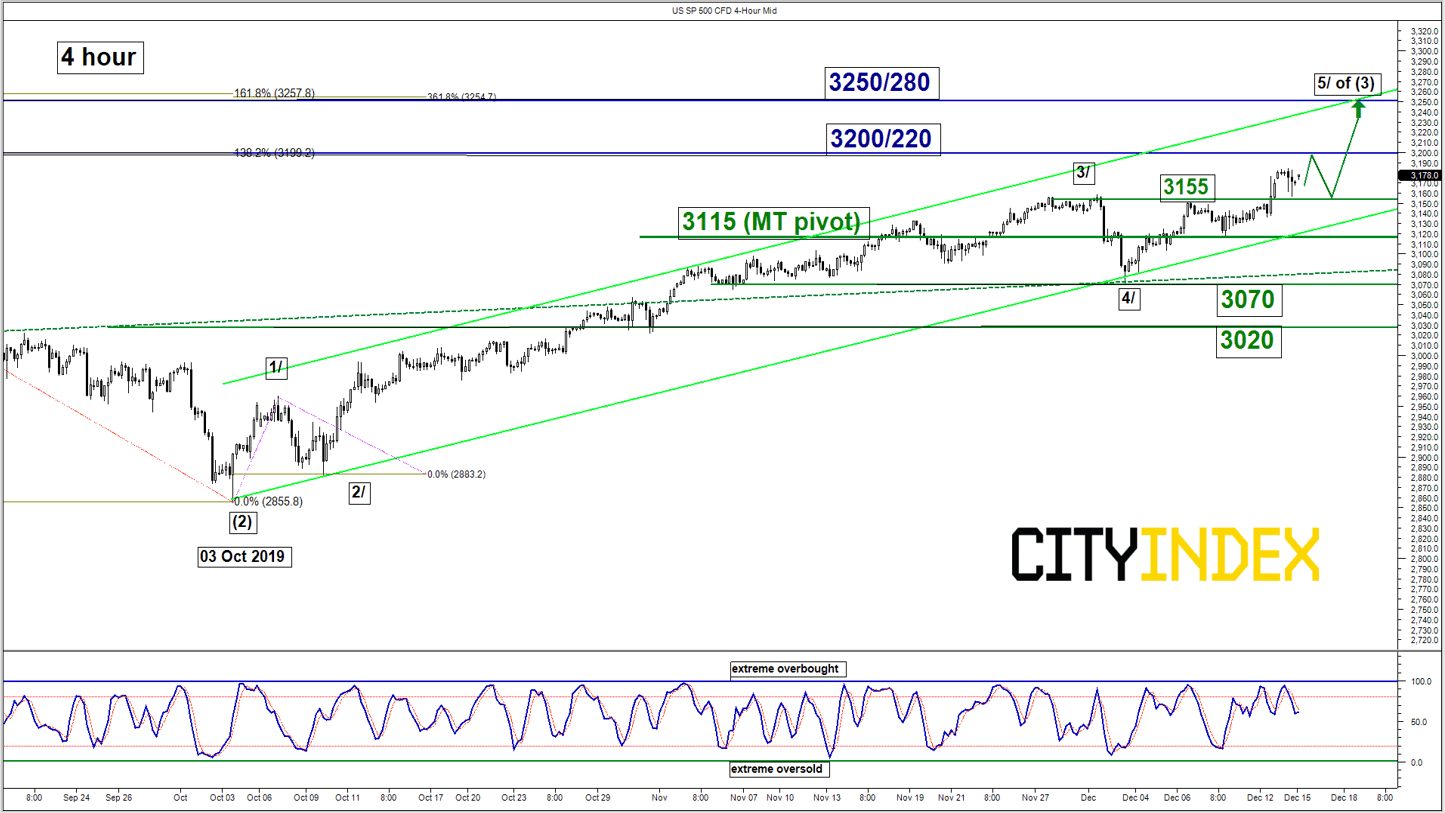
Intermediate support: 3155
Pivot (key support): 3115
Resistances: 3200/220 & 3250/280
Next supports: 3070 & 3020
Directional Bias (1 to 3 weeks)
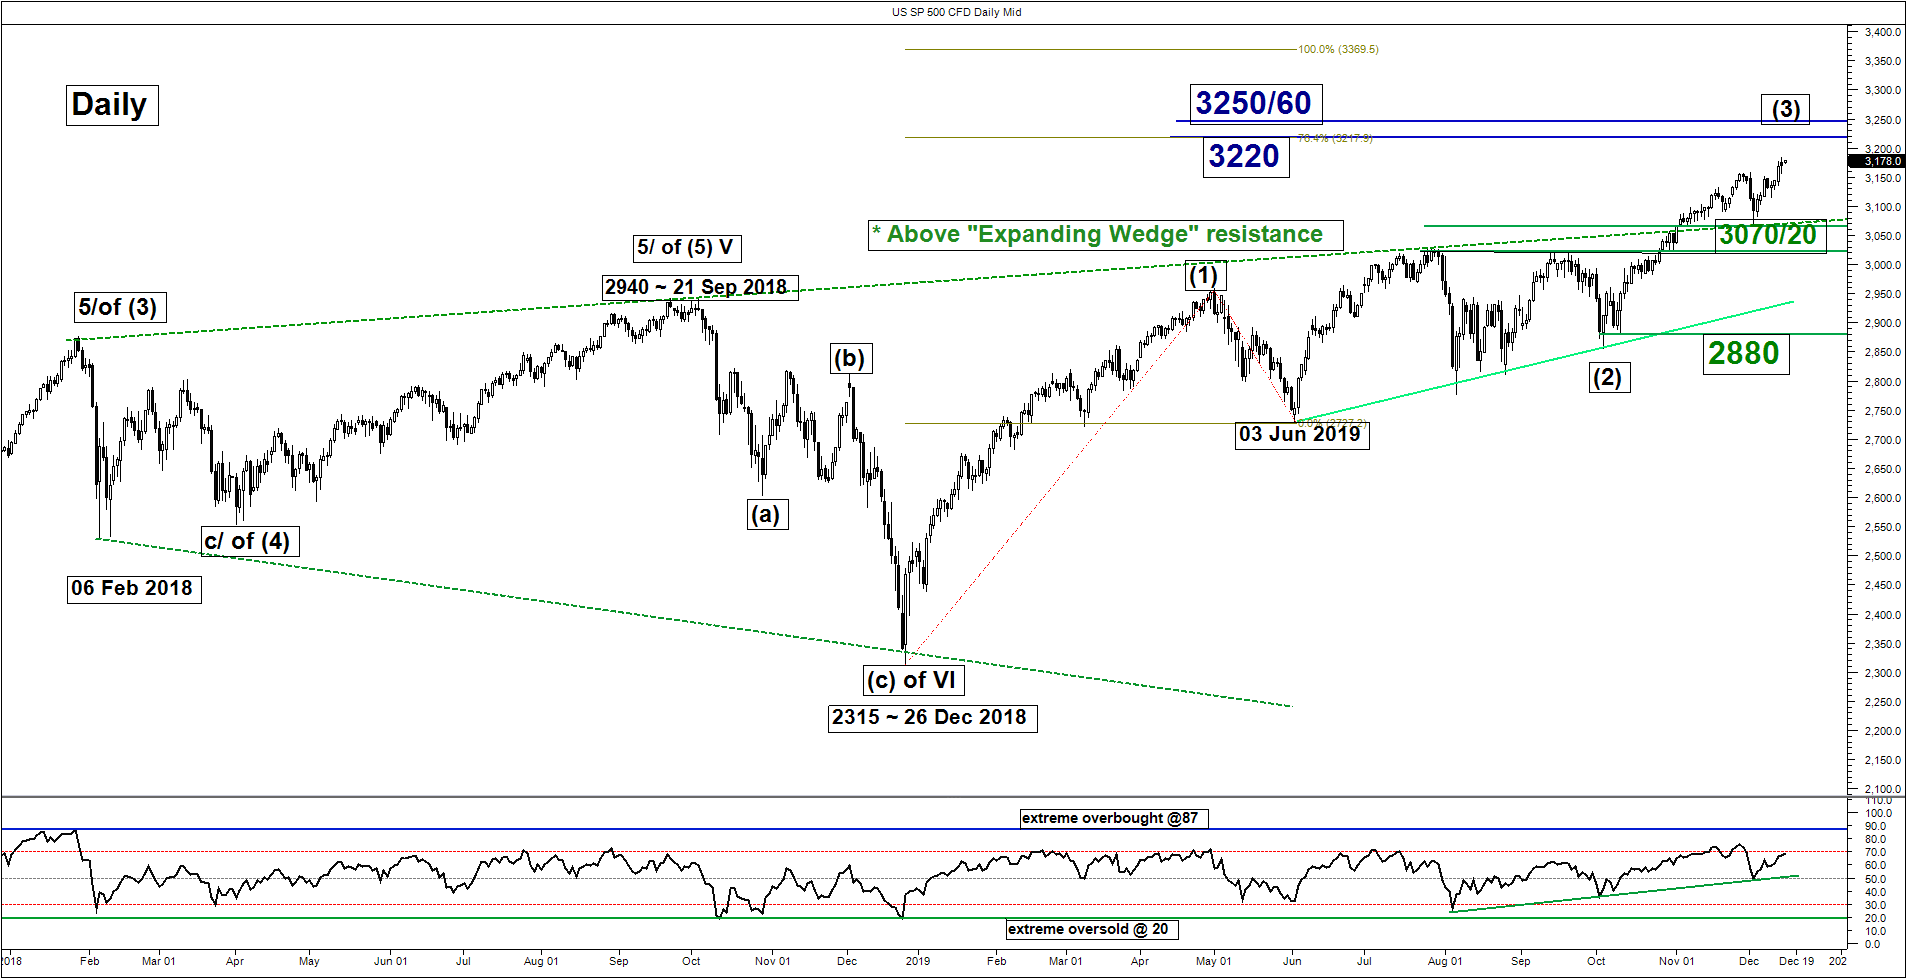
The SP 500 Index ((proxy for the S&P 500 futures) has staged the expected bullish break above the previous all-time high are of 3158/3155 and printed a fresh record intraday high of 3183 on last Fri, 13 Sep (click here for a recap).
Given that major event risks are now in the back seat at least for the next 2 weeks (UK elections over, Fed last meeting for 2019 concluded with additional liquidity programme implemented in the repo market & U.S-China Phase One trade deal agreed in principal), we maintain the bullish bias for any dips at a tightened key medium-term pivotal support at 3115 for a further potential up move to target 3200/200 follow by 3250/280 next.
However, a break with a daily close below 3115 negates the bullish tone for a multi-week corrective decline towards the next support at 3070 max 3020 before another potential impulsive up move sequence unfolds.
Key elements
- The daily RSI oscillator remains in a bullish configuration above a corresponding ascending support at the 50 level which indicates that medium-term upside momentum remains intact.
- The Index has continued to evolve within a medium-term ascending channel since 03 Oct 2019 low with the lower boundary of the ascending channel now acting as a support at 3115 that confluences with the 10 Dec 2019 minor swing low and a Fibonacci retracement cluster.
- The 3250/280 resistance zone is defined by the upper boundary of the aforementioned medium-term ascending channel and a Fibonacci expansion cluster.
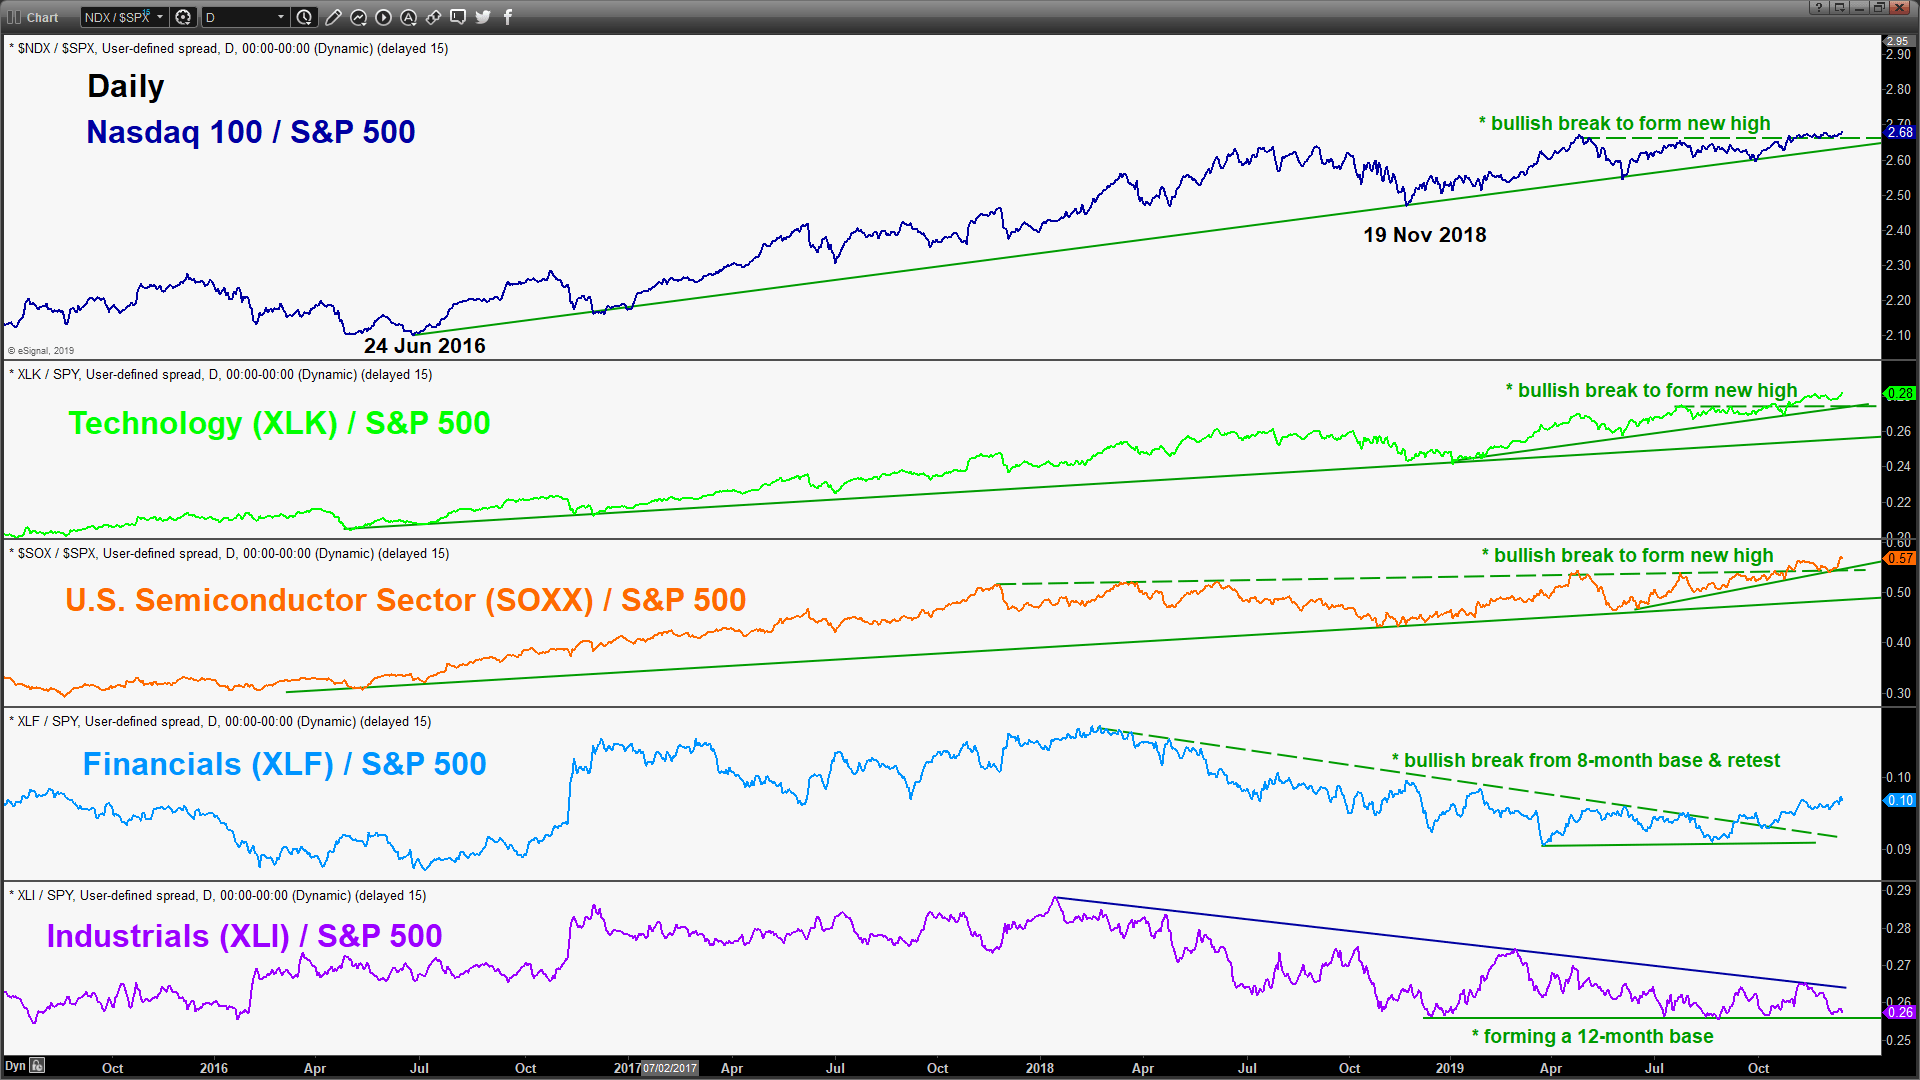
- Relative strength analysis/ratio charts have indicated continuation of leadership in the Technology and Semiconductor sectors. Laggards; Financials that has just started to outperform against the market (S&P 500) while the on-going underperformance of the Industrials have started to form a “base” which may be a precondition for further outperformance. These observations suggest that the S&P 500 is not forming a medium-ter topping process at this juncture.
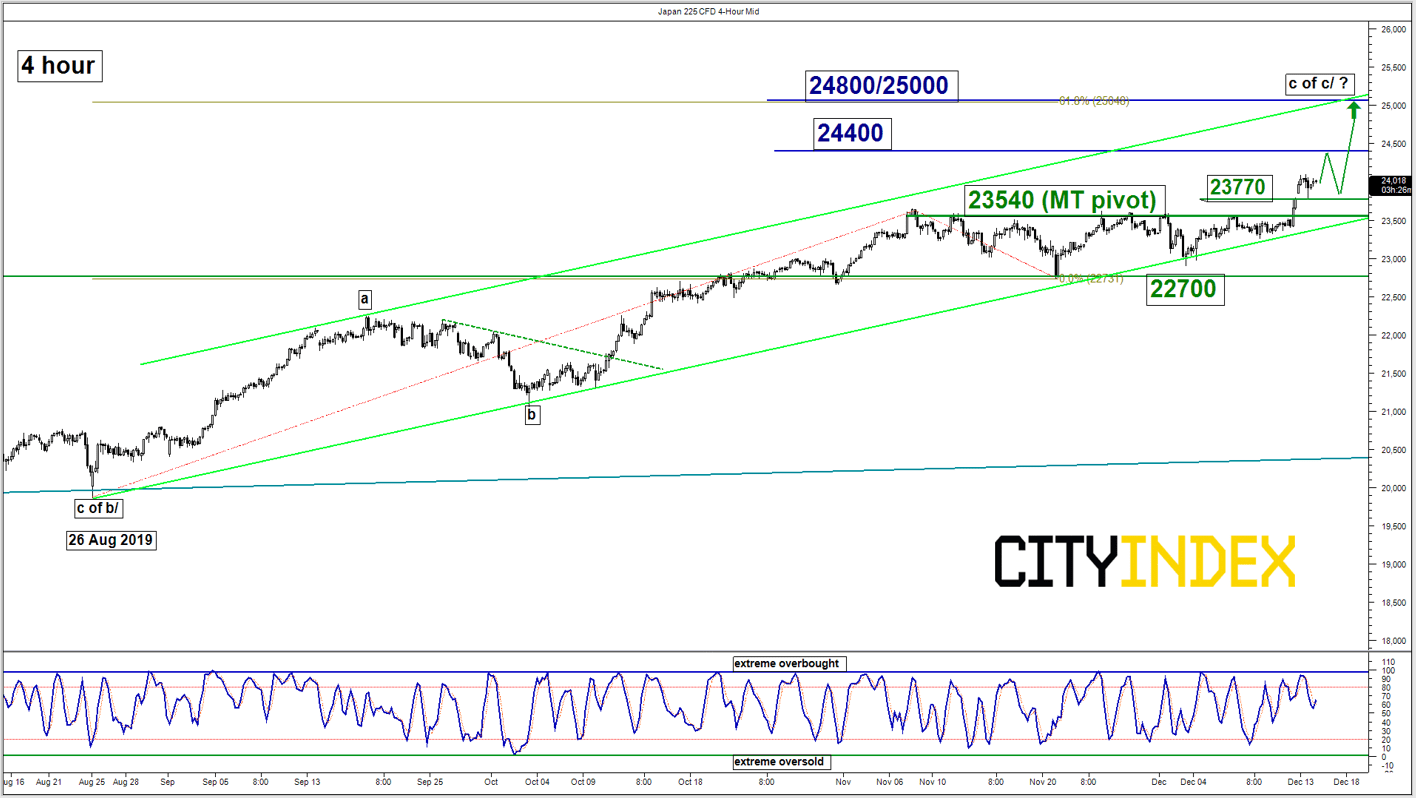
Nikkei 225 – Expected bullish breakout, eyeing 24800/25000 next
click to enlarge charts
Key Levels (1 to 3 weeks)
Intermediate support: 23770
Pivot (key support): 23540
Resistances: 24400 & 24800/25000
Next supports: 22700
Directional Bias (1 to 3 weeks)
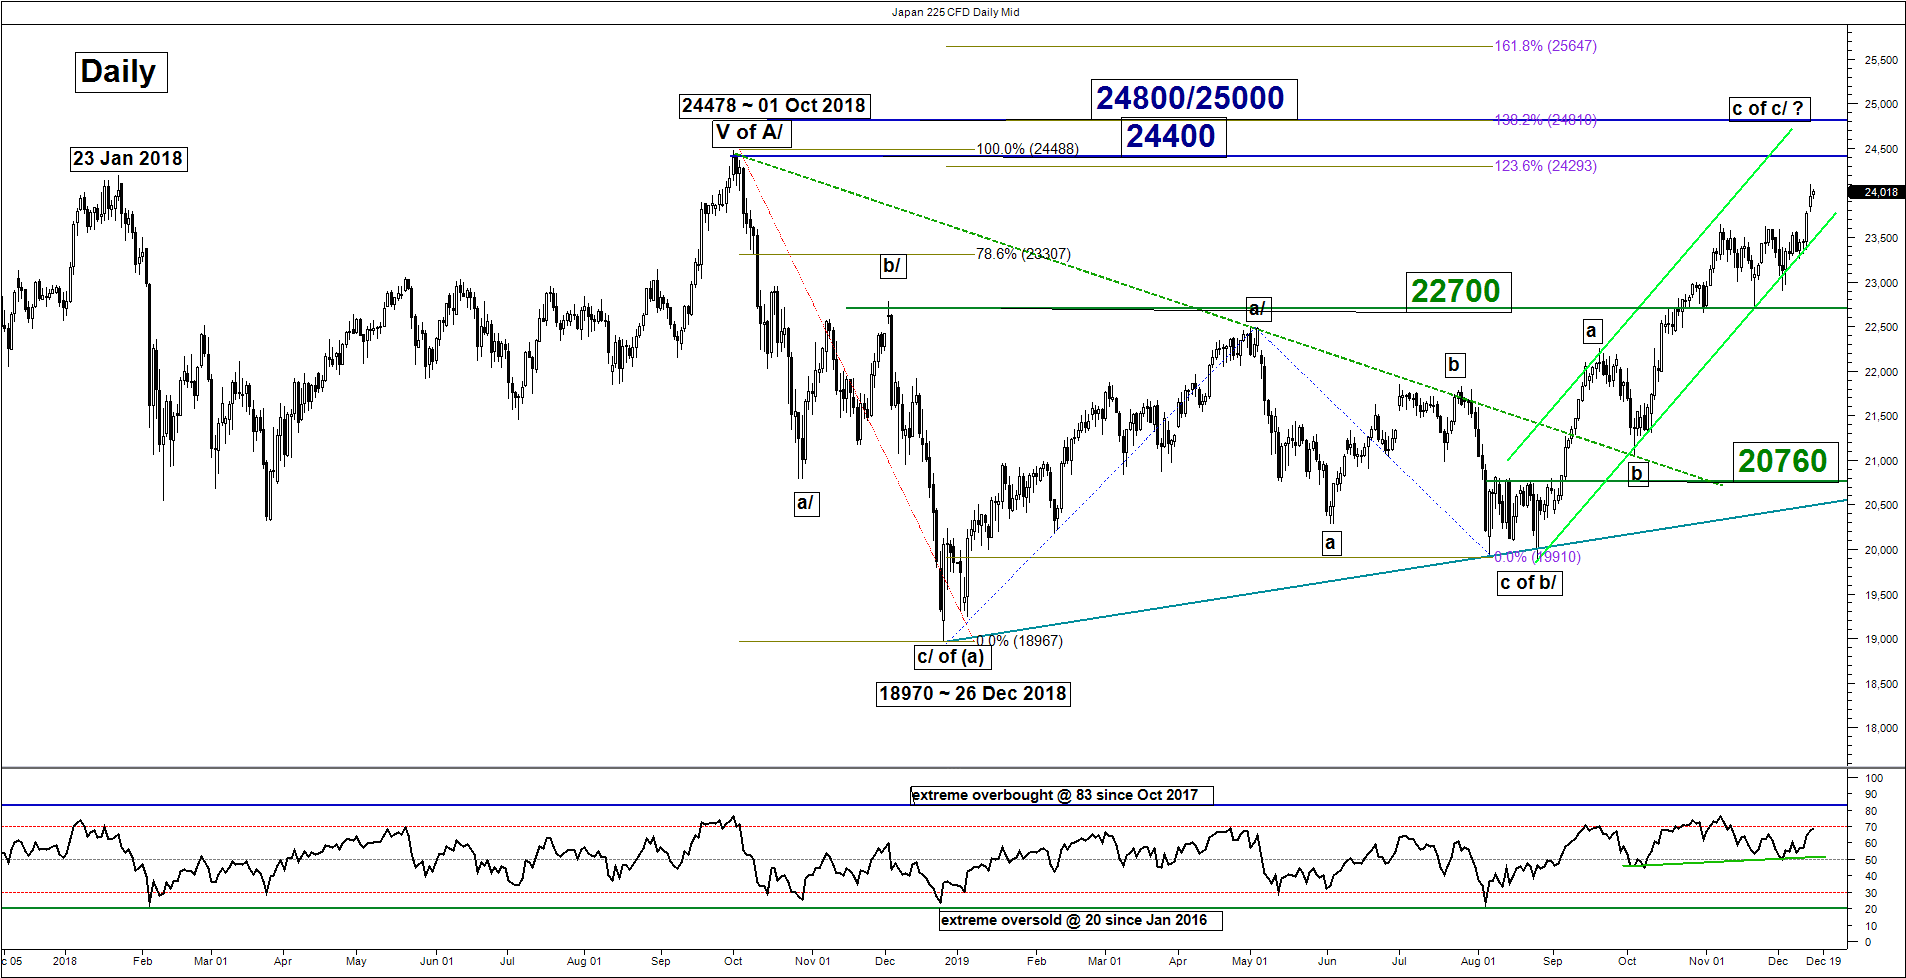
The Japan 225 Index (proxy for the Nikkei 225 futures) has staged the expected bullish breakout as per highlighted in our previous report and surged to a 52-week high at 24050.
Maintain bullish bias in any dips above a tightened key medium-term pivotal support now at 23540 for a further potential push up to retest 01 Oct 2018 swing high area of 24400 before targeting 24800/2500 next.
However, a break with a daily close below 23540 negates the bullish tone for a deeper corrective slide to retest 22700 support (the former major range resistance of a sideway configuration from 26 Dec 2018/23 Oct 2019).
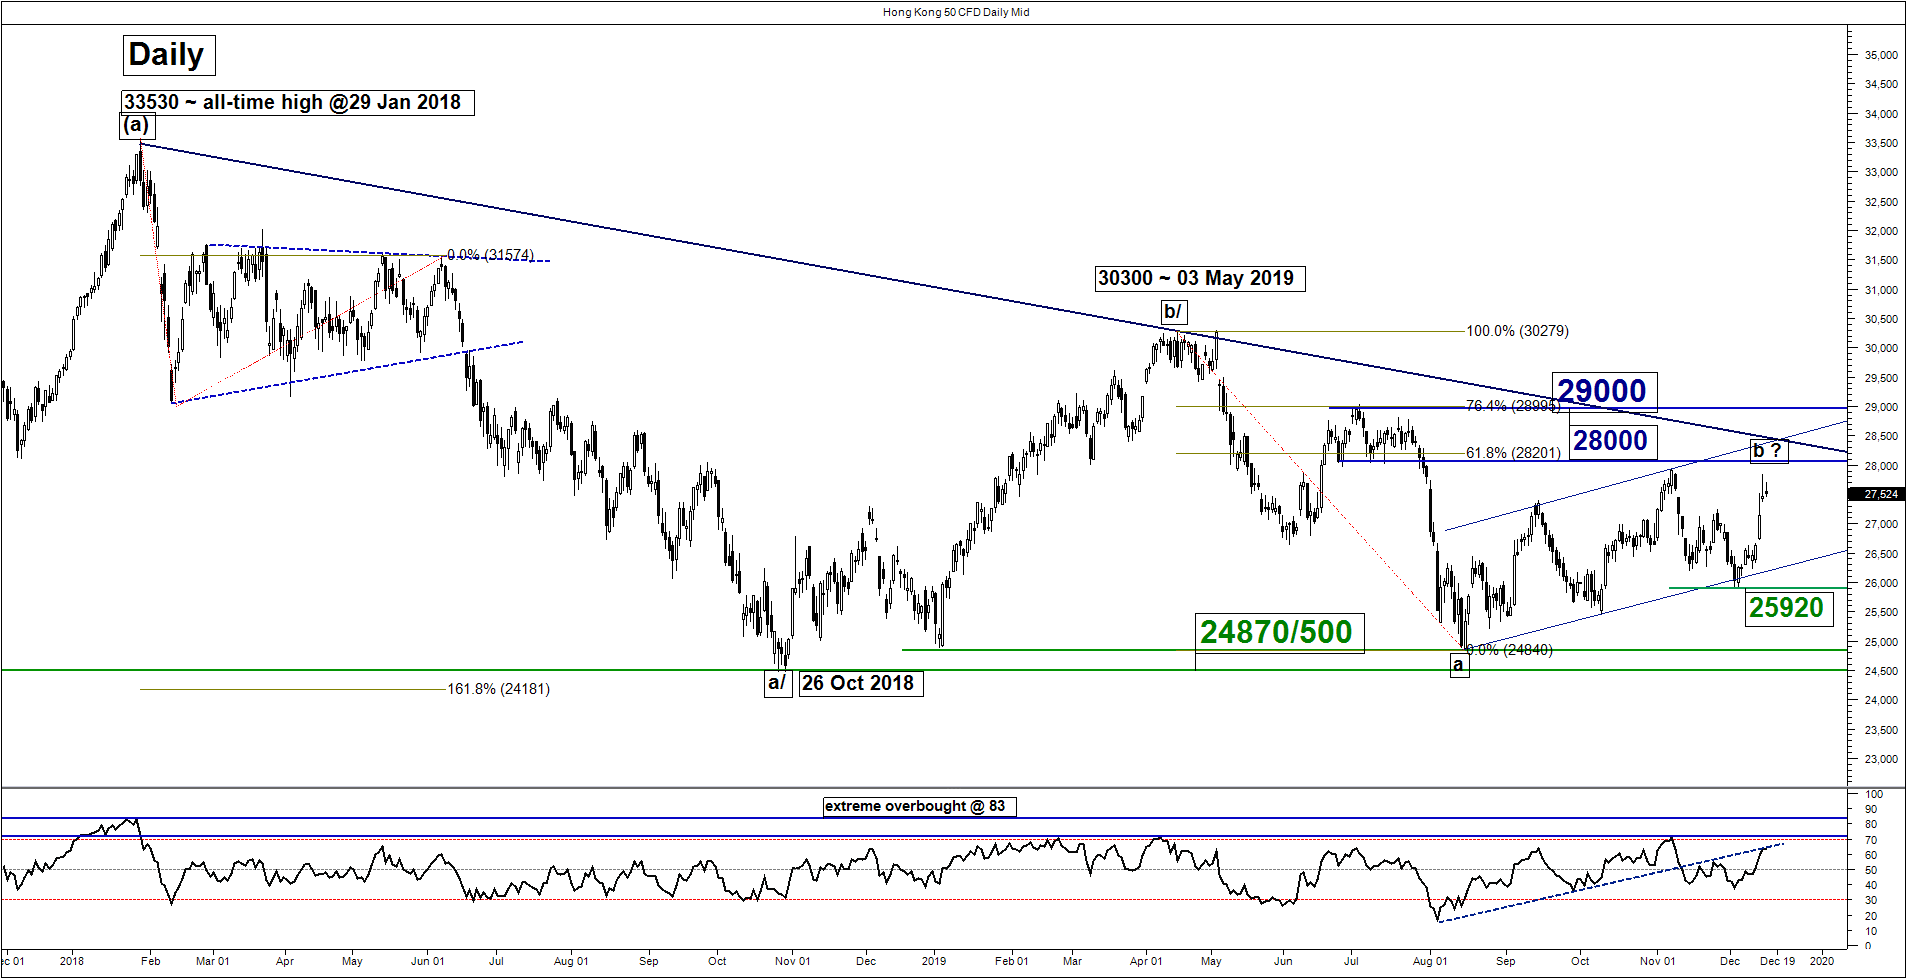
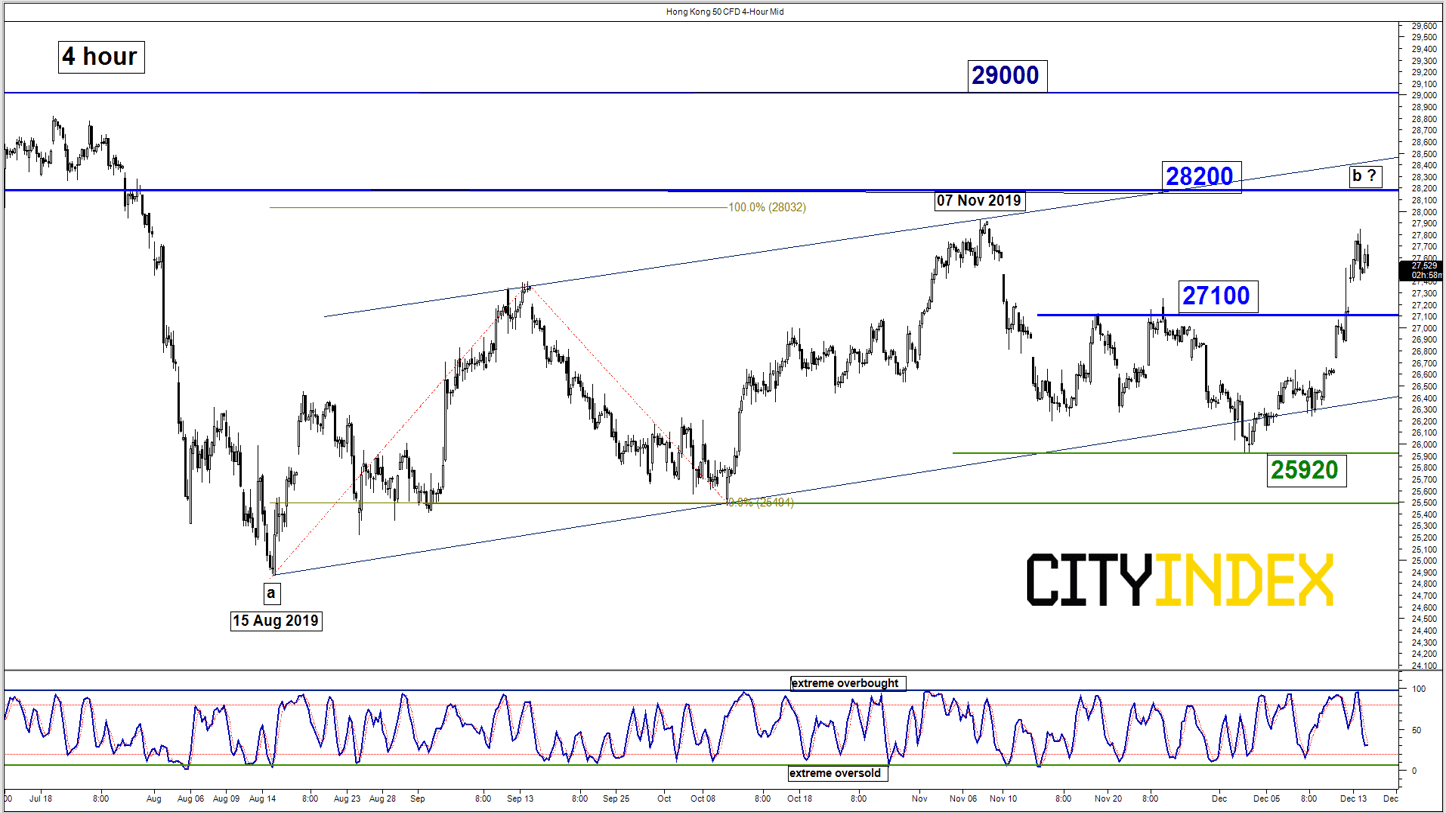
Hang Seng – Turn neutral, watch 28200 range resistance
click to enlarge charts
Key Levels (1 to 3 weeks)
Resistances: 28200 & 29000
Supports: 27100 & 25920
Directional Bias (1 to 3 weeks)
The Hong Kong 50 Index (proxy for Hang Seng Index futures) has surged higher and broke above the 27350 resistance that has invalidated the push down scenario to retest the range support at 25500.
Despite last week’s gain of 4.45%, the best performance since Sep 2019, the Index is still trading in a complex sideways configuration in place since 26 Oct 2018 low of 24870 with a major descending trendline in place since 29 Jan 2018 all-time high now acting as a resistance at 28000/200.
Mix elements; prefer to turn neutral between 28200 and 27100 where bears need to have a break below 27100 to reinstates a potential slide to retest the 03 Dec 2019 swing low of 25920.
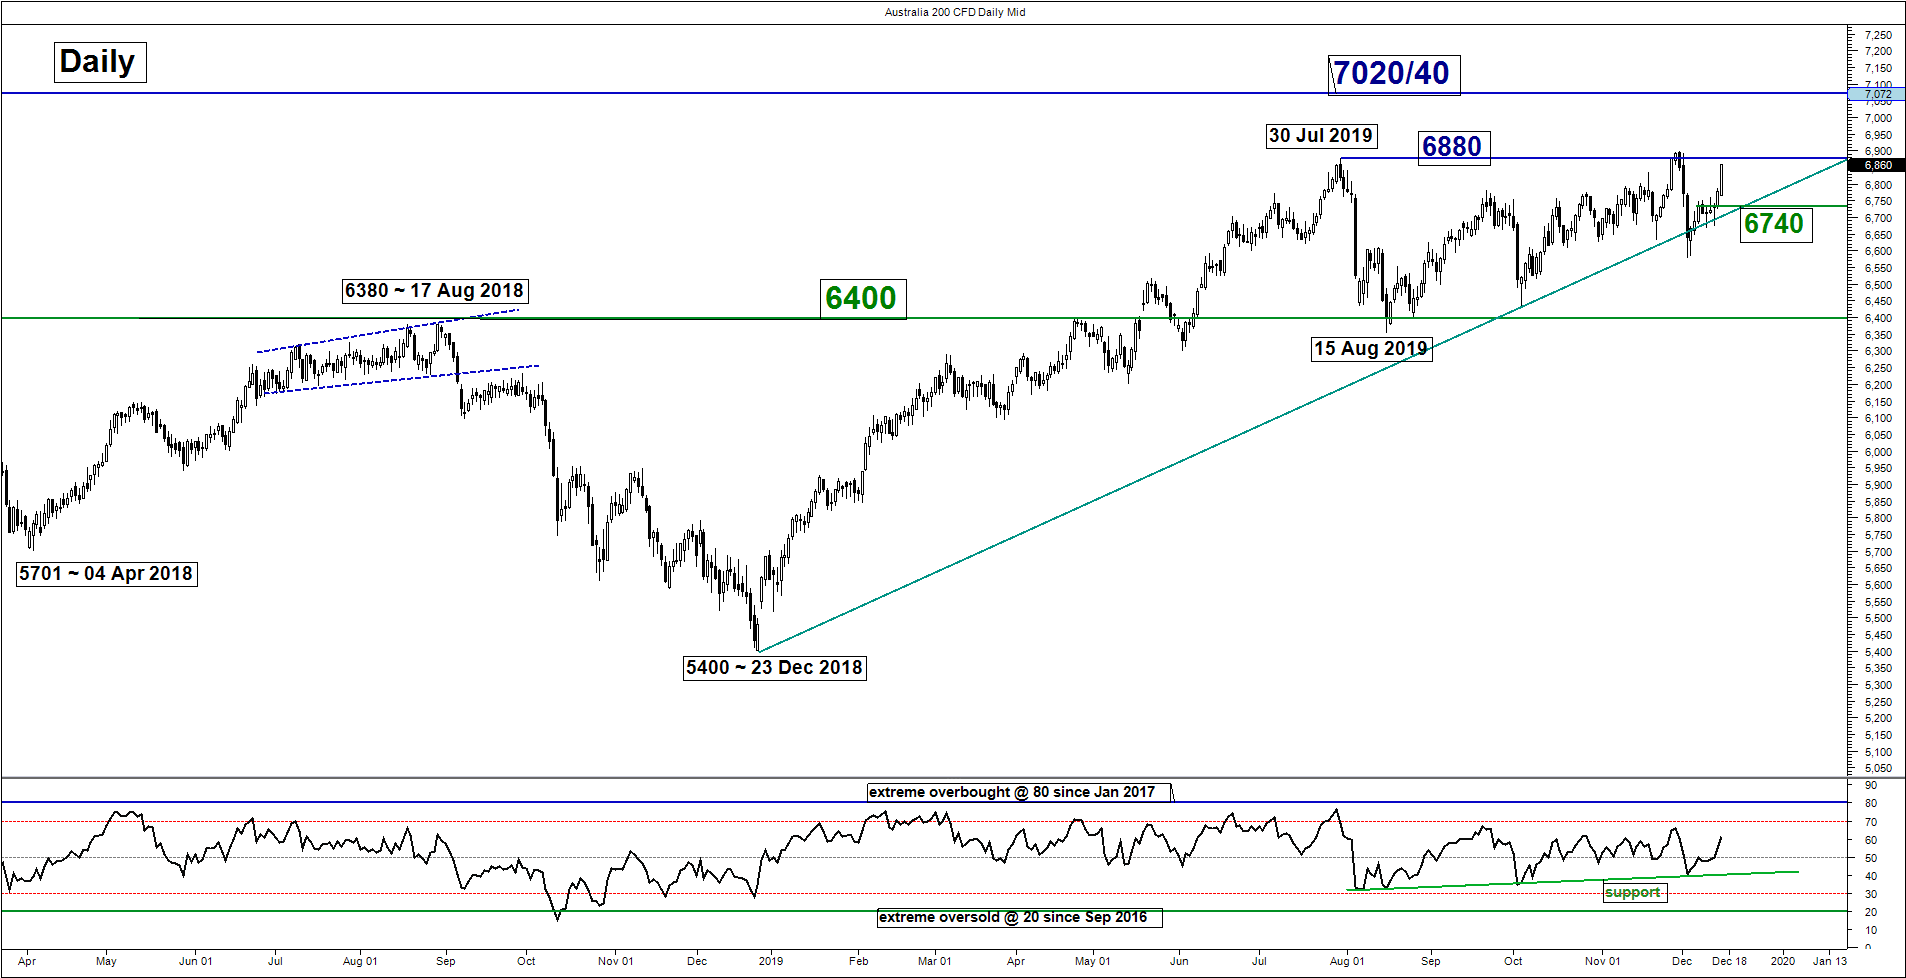
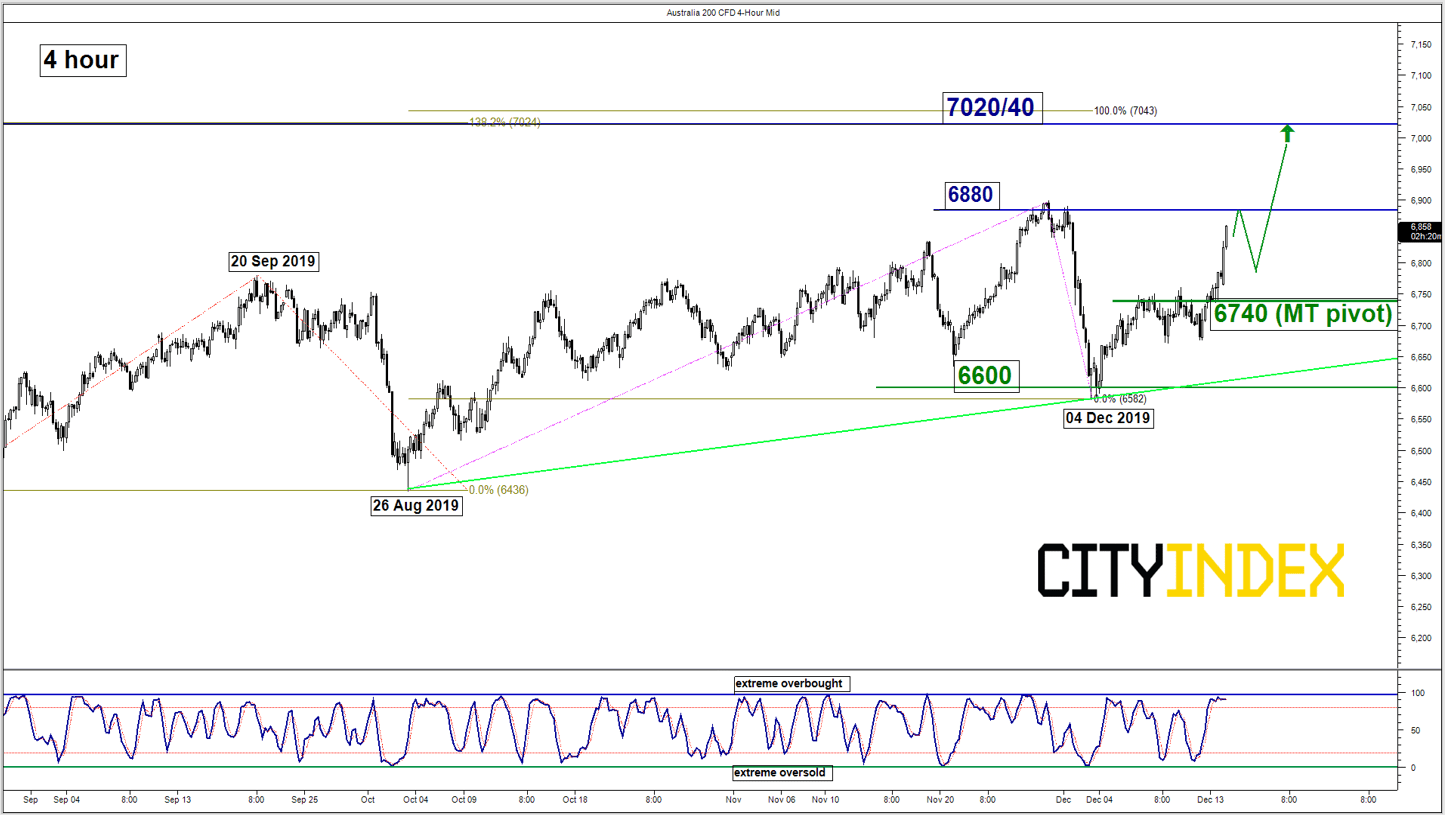
ASX 200 – Potential bullish breakout, eyeing new all-time high
click to enlarge charts
Key Levels (1 to 3 weeks)
Pivot (key support): 6740
Resistances: 6880 & 7020/40
Next supports: 6600 & 6400
Directional Bias (1 to 3 weeks)
Since its 04 Dec 2019 low of 6600, Australia 200 (proxy for the ASX 200 futures) has started to stage of 3 % from a major ascending trendline support in place since 23 Dec 2019 low.
In today’s Asian session, 16 Dec, it has continued to push higher to print a current intraday high of 6864, just 0.23% away from the 6880/6899 current all-time high. Elements have turned positive, we flip to a bullish bias in any dips above the 6740 key medium-term pivotal support for a potential bullish breakout above 6880 to target the next resistance zone at 7020/40 in the first step.
However, a break with a daily close below 6740 invalidates the bullish scenario for a corrective decline towards 6600 and even 6400 next.
Key elements
- Current price action has formed an impending daily “Bullish Marubozu” candlestick pattern which indicates a strong positive session.
- The daily RSI remains in a bullish configuration above a corresponding ascending support at the 40 level which indicates that medium-term upside momentum remains intact.
- The 7020/40 resistance zone is defined by a Fibonacci expansion cluster.
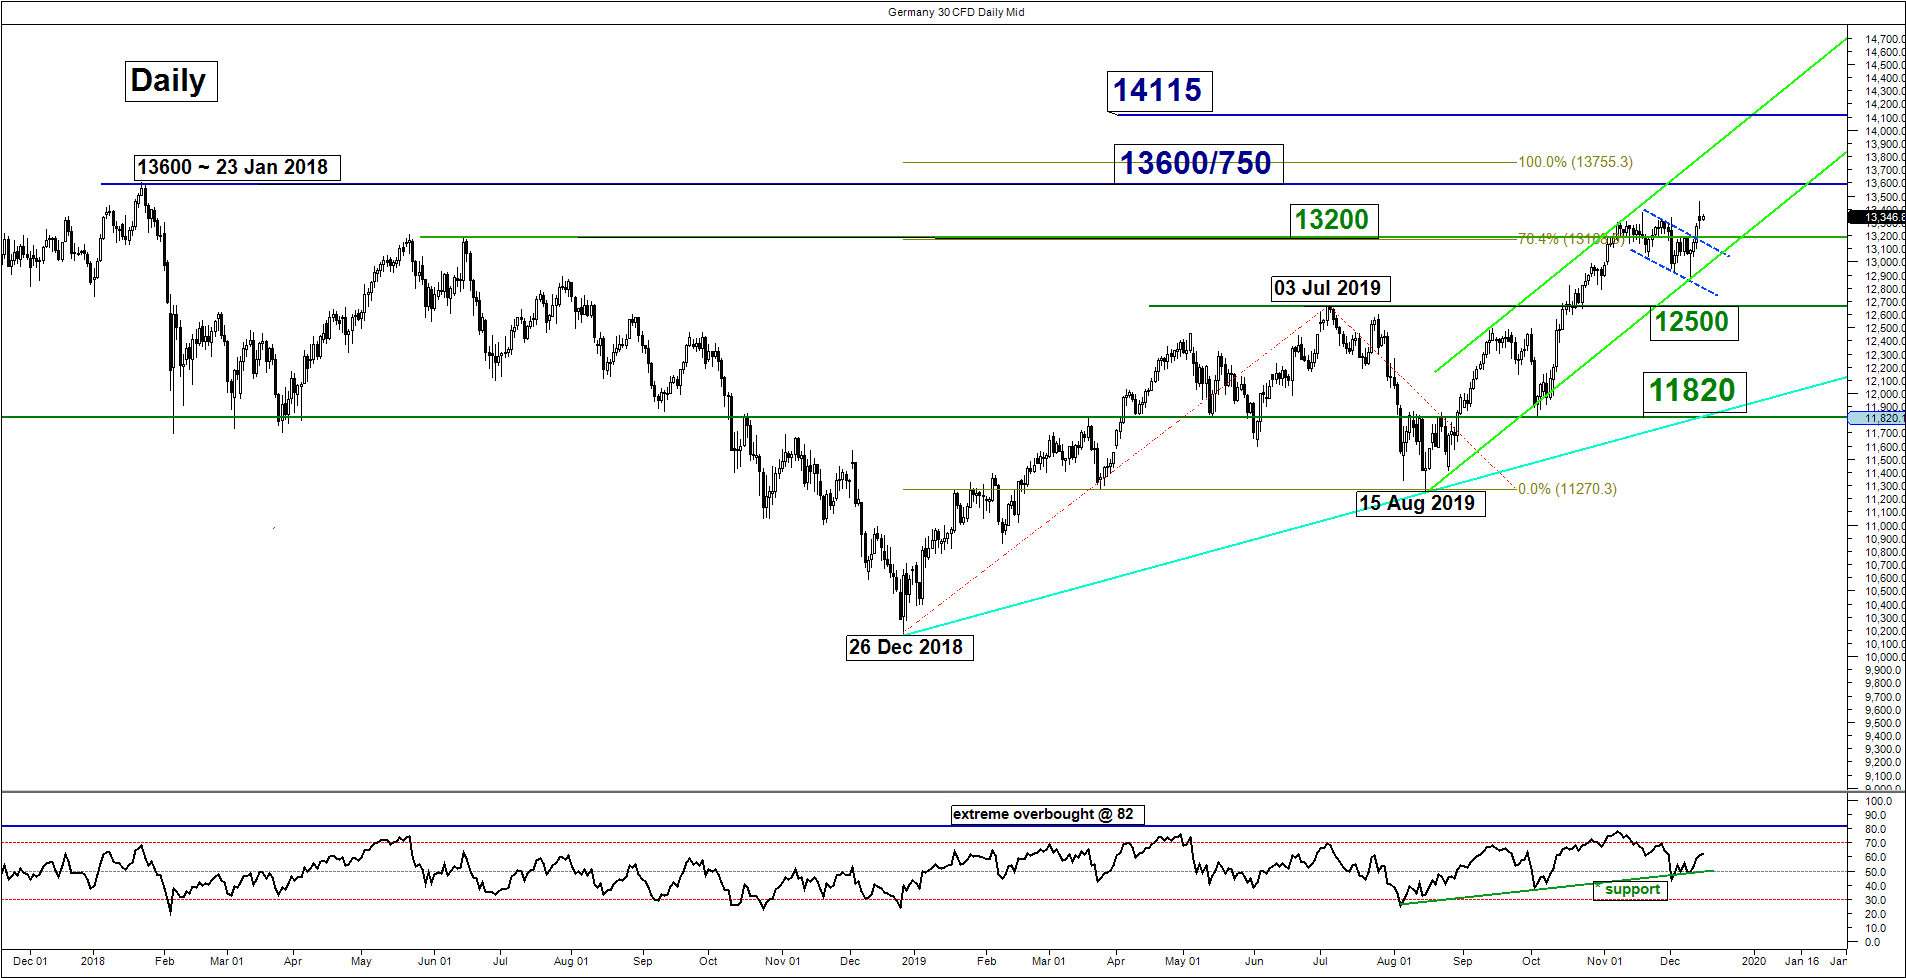
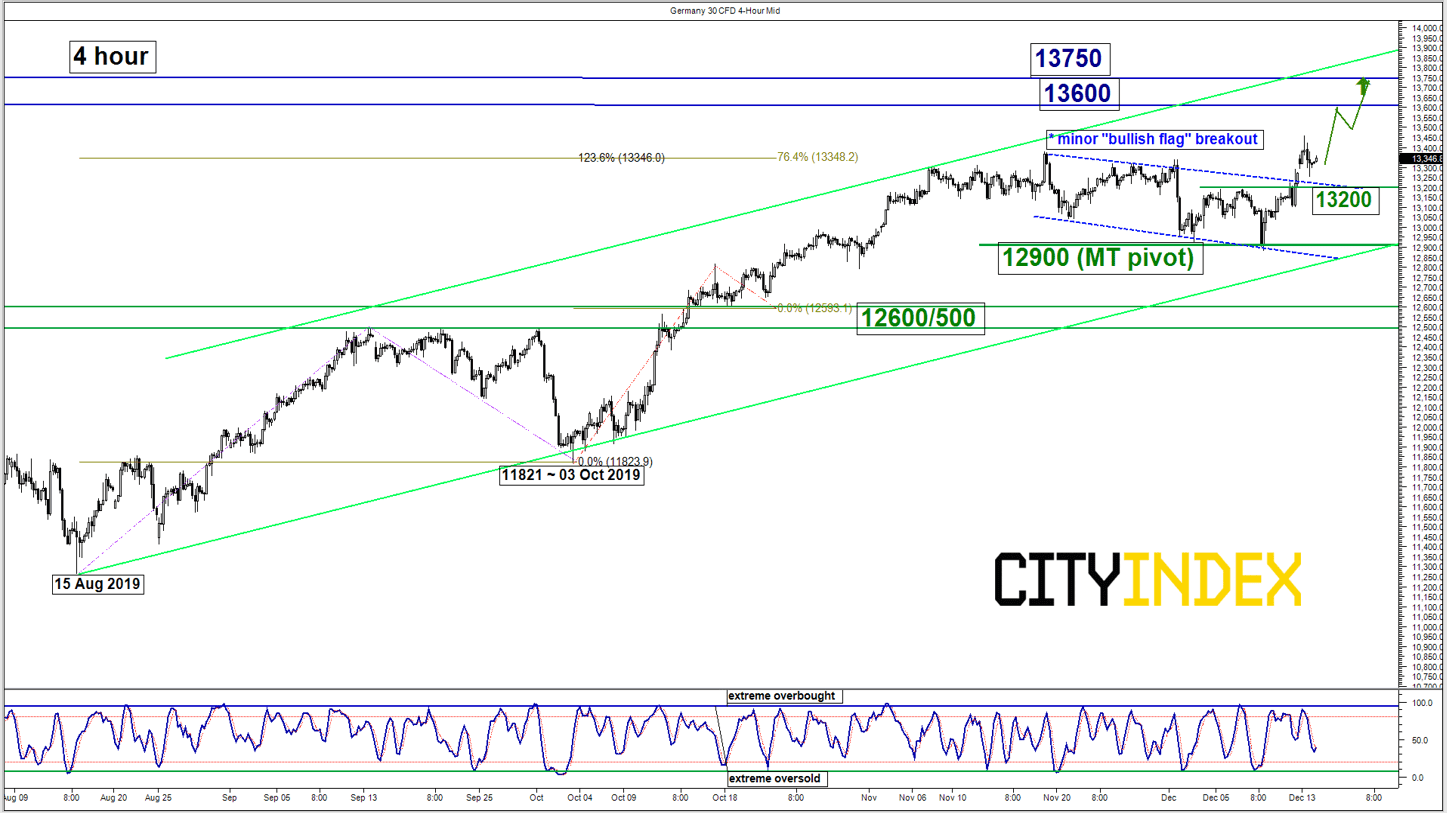
DAX – Bullish flag breakout, eyeing all-time high area next
click to enlarge charts
Key Levels (1 to 3 weeks)
Intermediate support: 13200
Pivot (key support): 12900
Resistances: 13600, 13750 & 14115
Next support: 12600/500
Directional Bias (1 to 3 weeks)
The Germany 30 Index (proxy for the DAX futures) has staged a bullish breakout from a minor “flag” configuration in place since 19 Nov 2019 high of 13376 with positive elements. Flip to a bullish bias in any dips above 12900 key medium-term pivotal support for a further potential push up to target 13600 (all-time high area) follow by 13750 (Fibonacci expansion cluster) next in the first step.
However, a break with a daily close below 12900 negates the bullish tone for a deeper corrective slide to retest the next support at 12600/500 (the former major swing high area of 03 Jul 2019) before another impulsive up move sequence unfolds.
Key elements
- The 12900 key medium-term support is defined by the lower boundary of the ascending channel in place since 15 Aug 2019 low and the 23.6% Fibonacci retracement of the entire on-going up move from 15 Aug low to 13 Dec 2019 high).
- The daily RSI oscillator has staged a rebound at the 50 level and a corresponding ascending support which indicates a revival of medium-term upside momentum.
- The pull-back support of the former minor “bullish flag” resistance rests at 13200.
Charts are from City Index Advantage TraderPro & eSignal
Latest market news
Latest Indices articles

April 17, 2024 11:00 AM
April 16, 2024 08:00 PM
April 16, 2024 04:54 PM